Important to Note:
Before using the Filter Widget, keep these points in mind:Note
- The filter widget can only be linked to other widgets that have the same data source.
- The filter widget can only be applied to a single widget where filtering has already been applied.
Adding a Filter Widget
1
Add a Filter Widget
In the Edit Mode tab of the Dashboards Building Interface, click the “add a widget” button. Choose the Filter option from the widget list.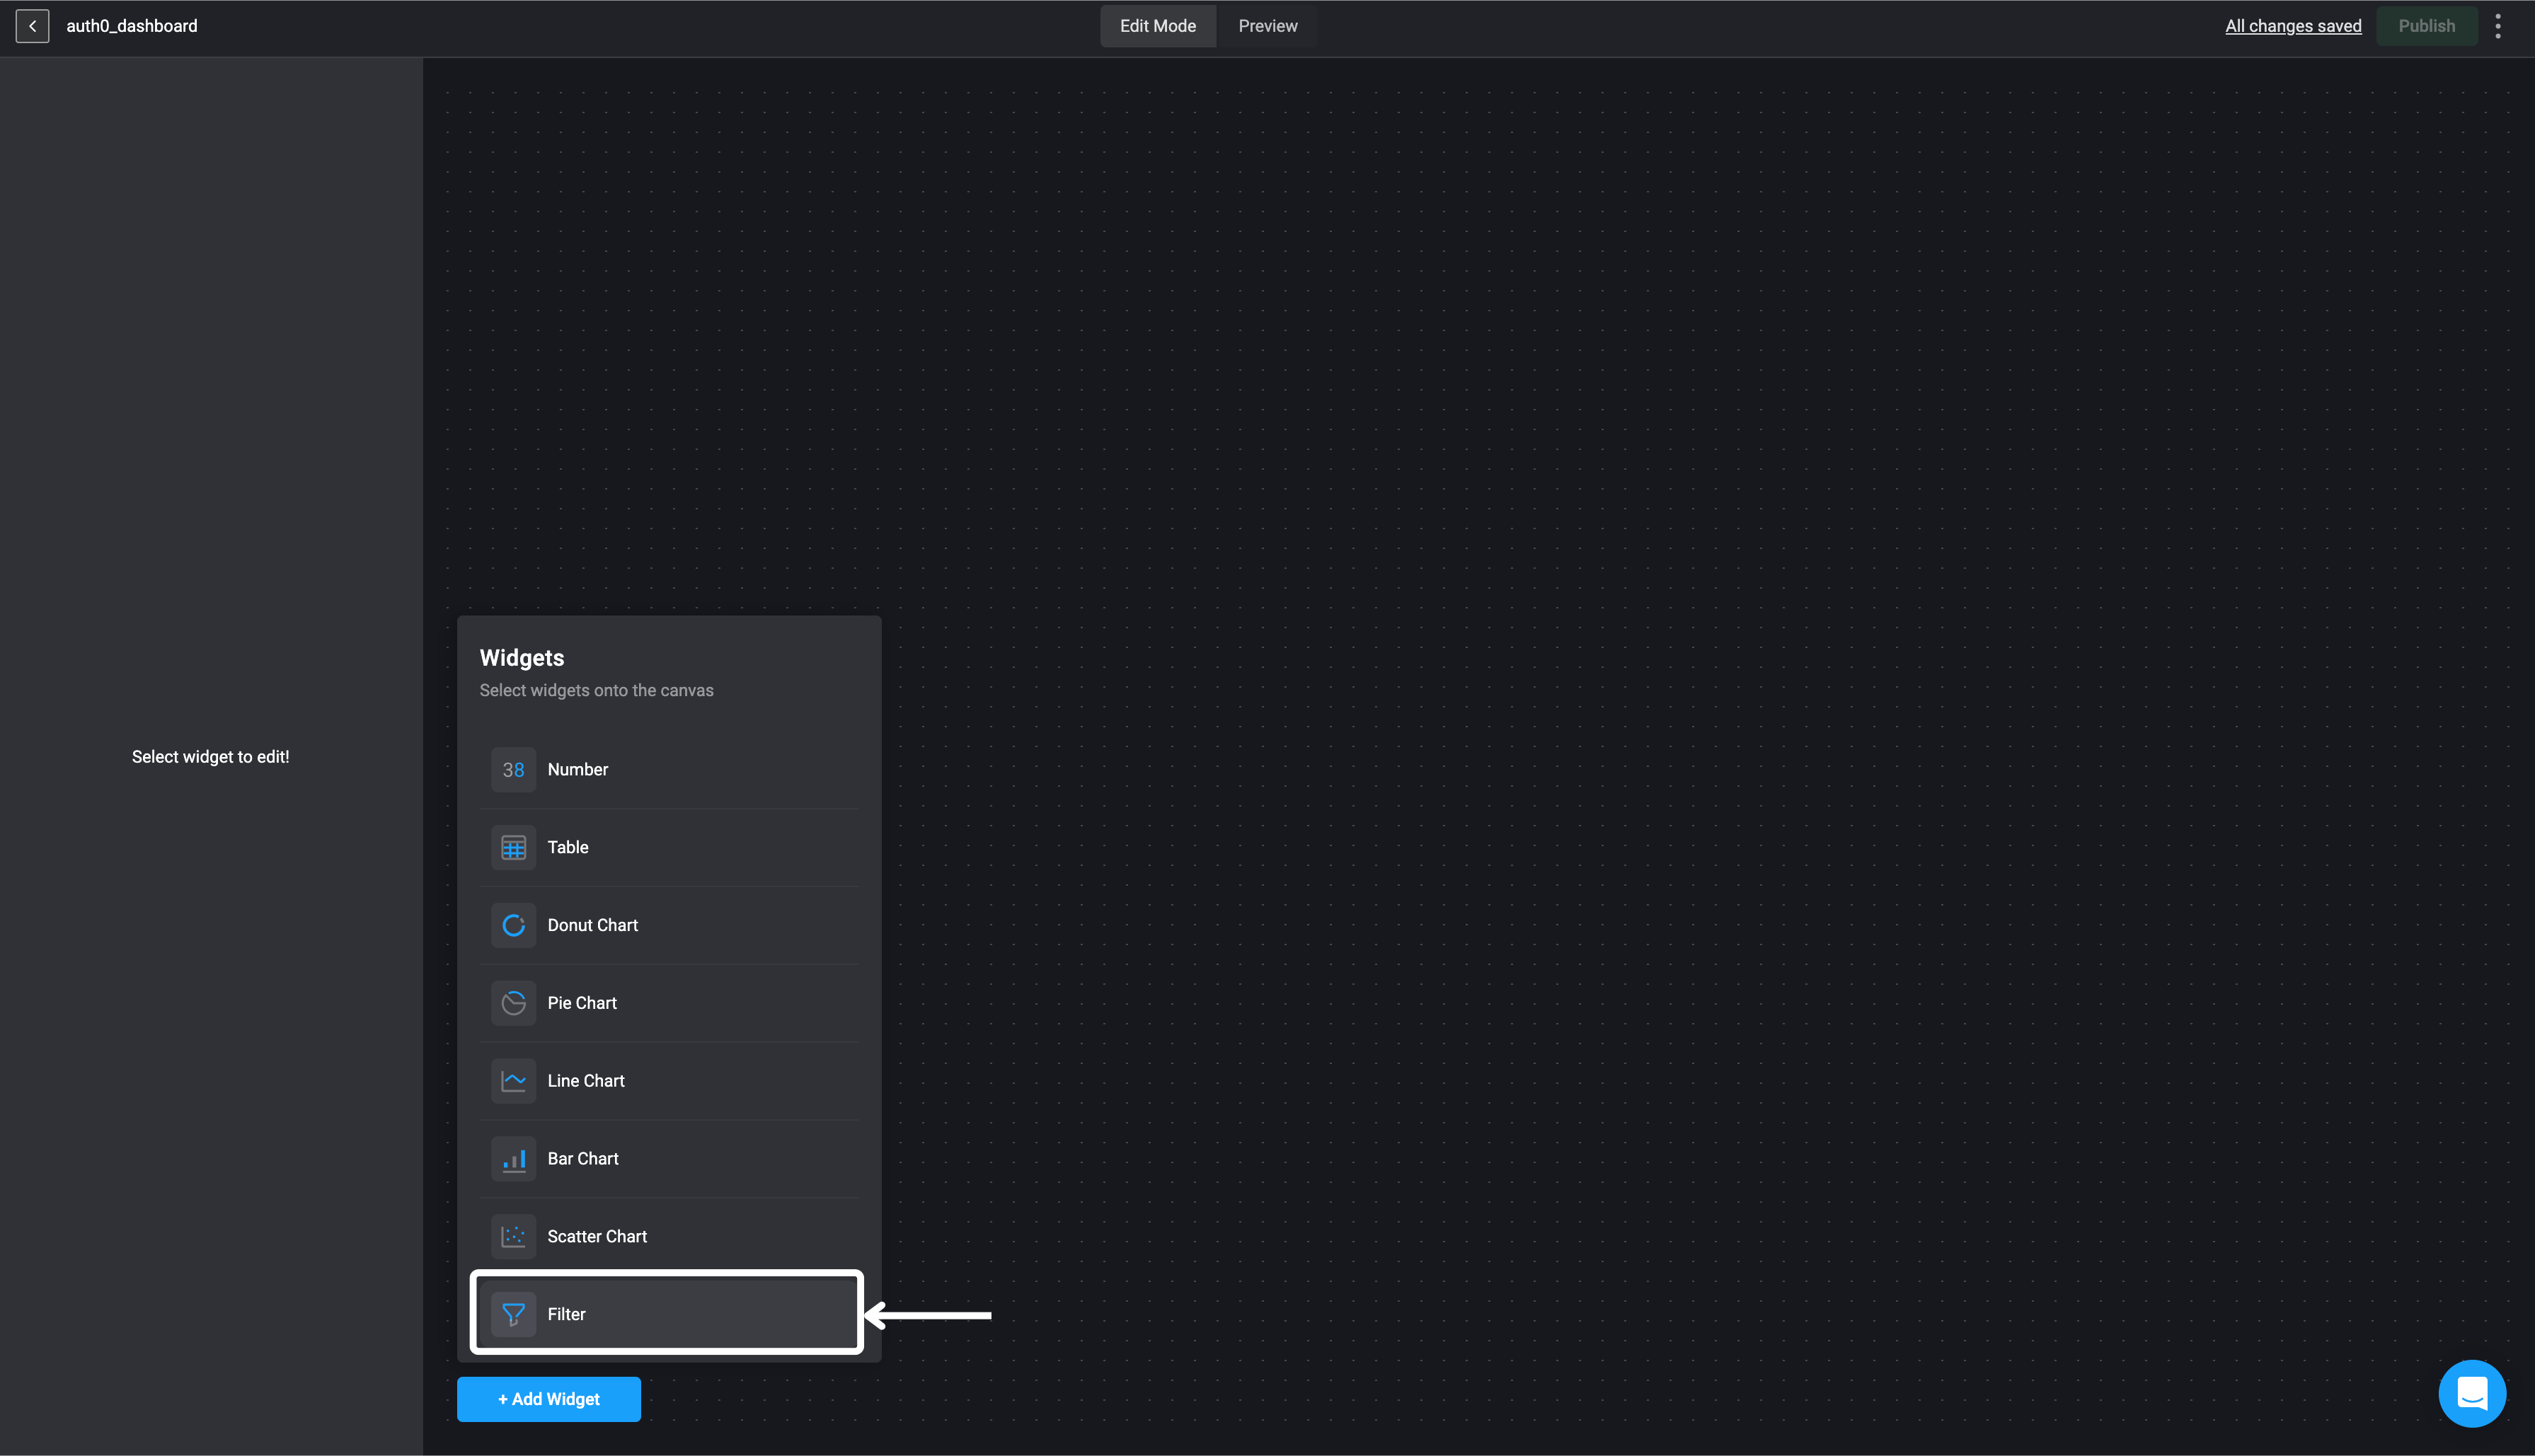
2
Name the Widget
In the sidebar in the top left corner, double-click on Untitled widget and provide a name for the selected widget.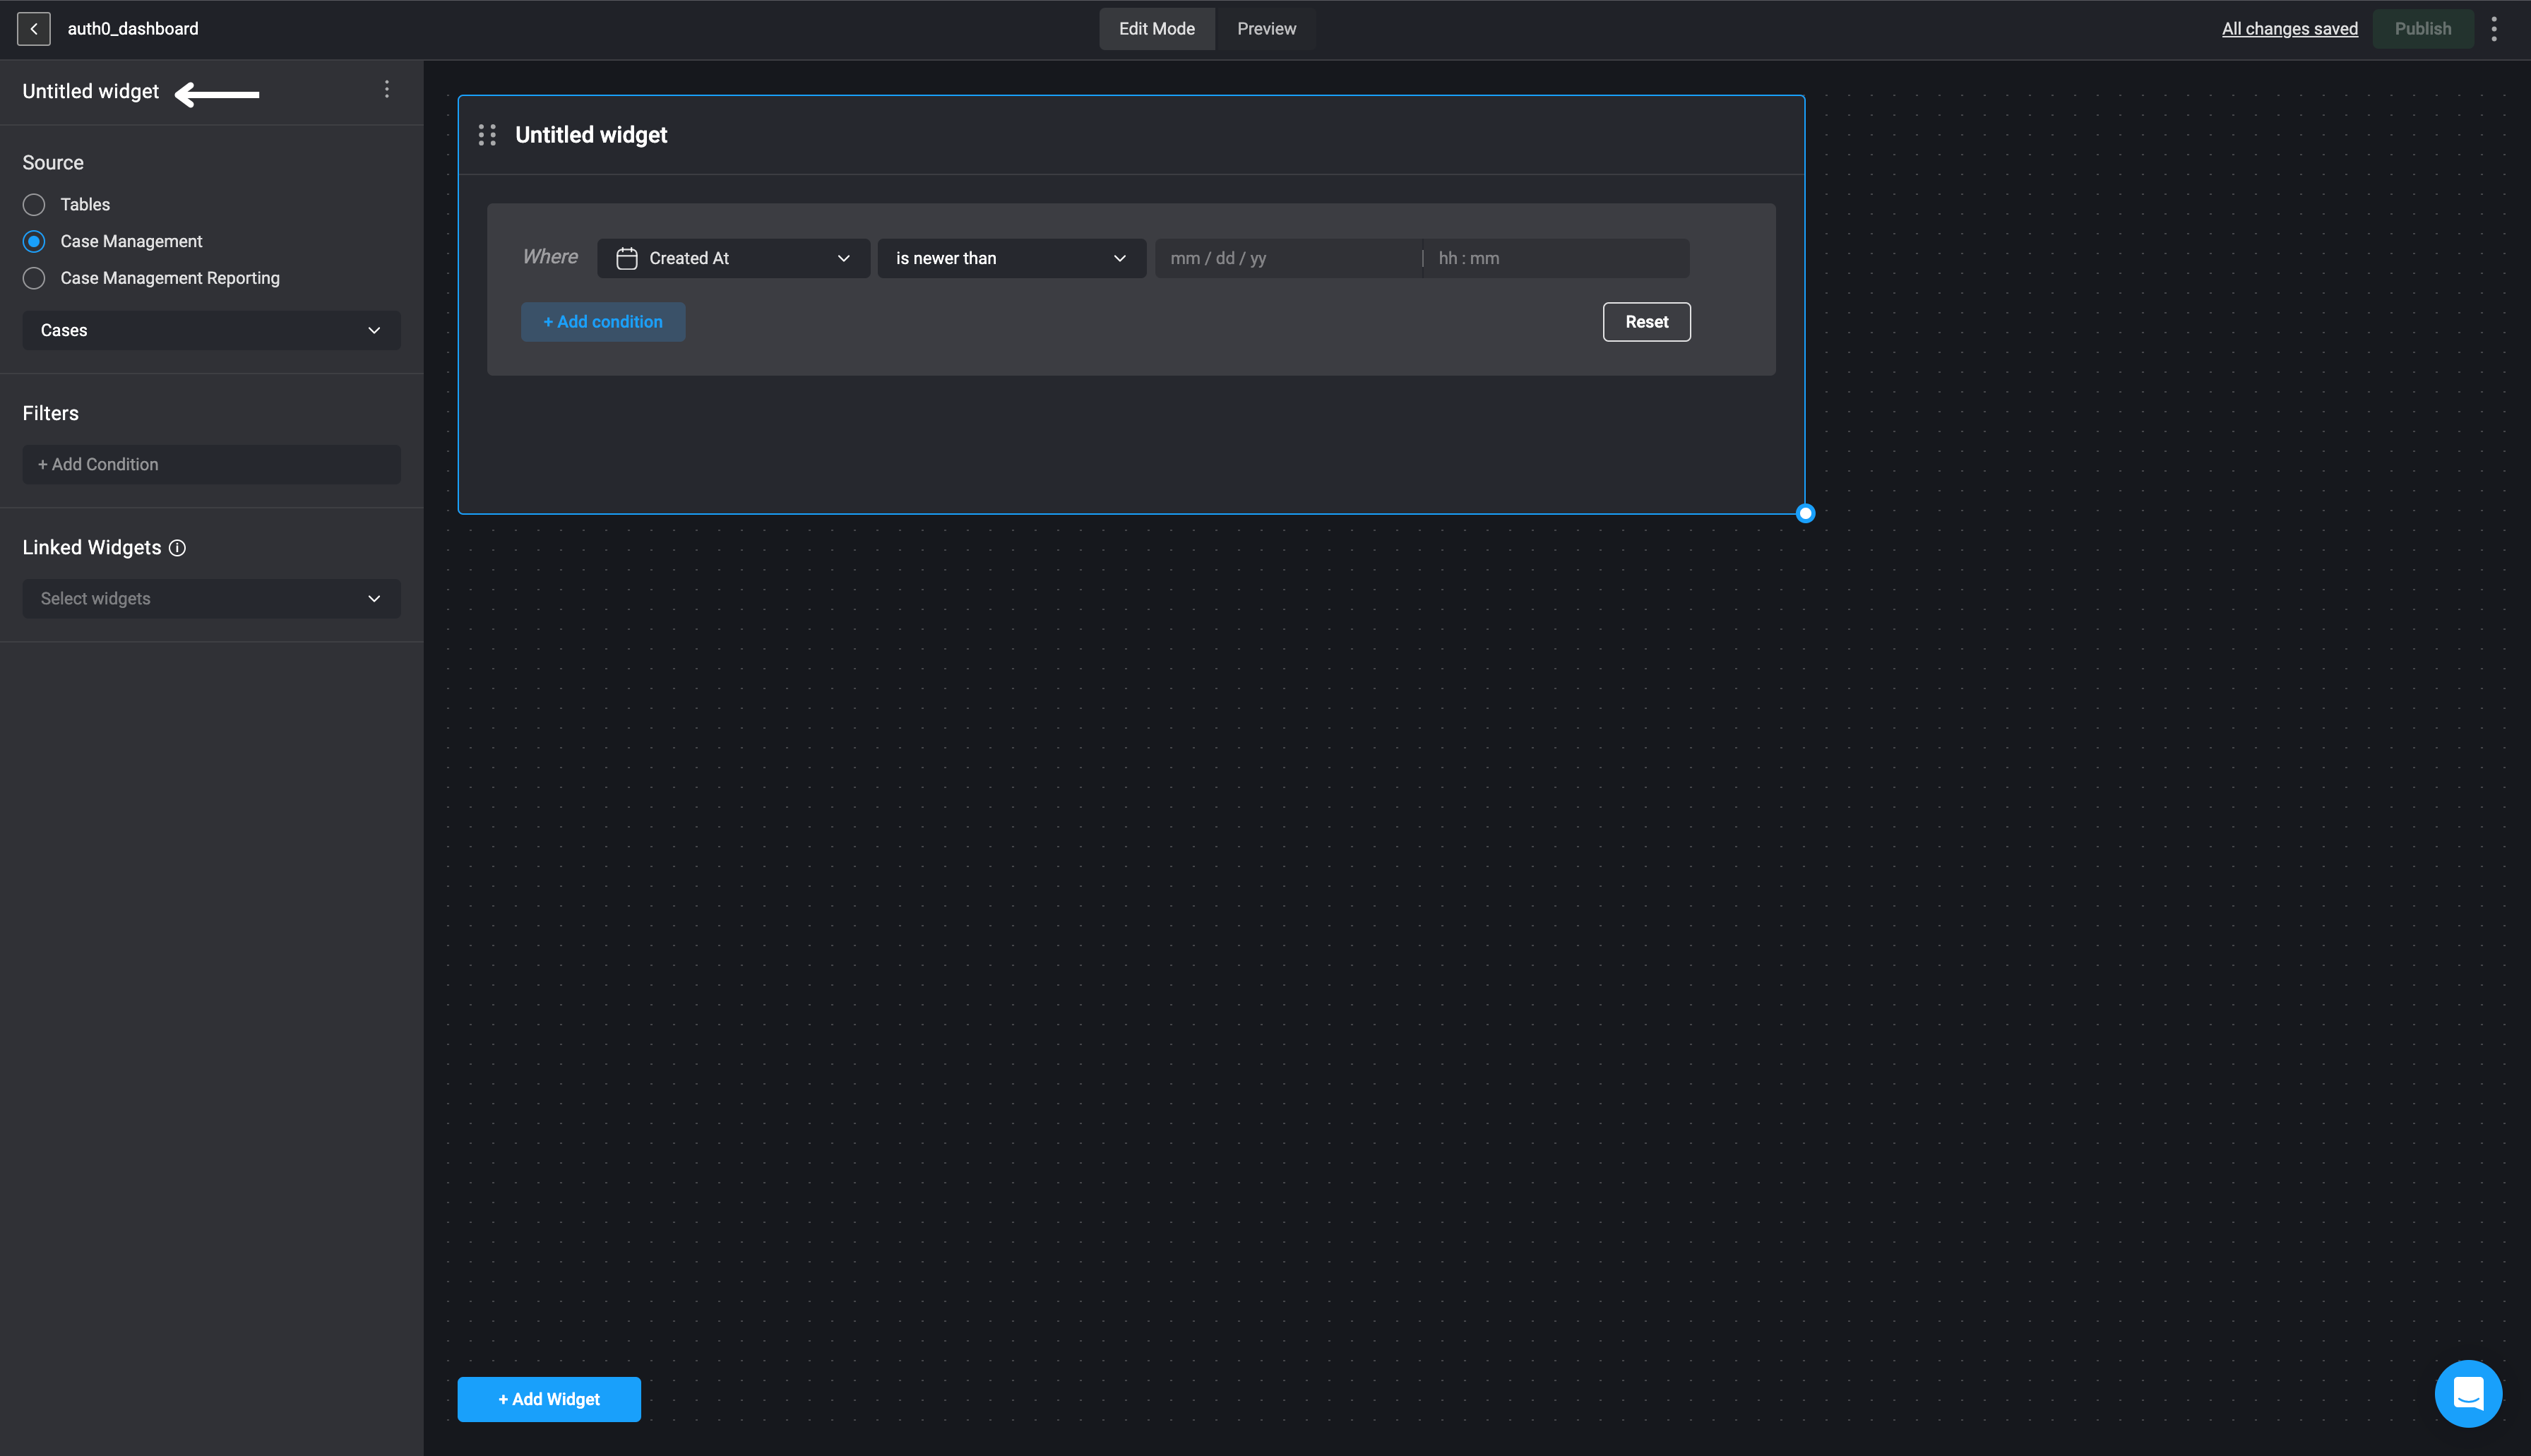
3
Select a Data Source and Column
Choose a data source: Tables, Case Management Tables or Case Management Reportings and proceed by selecting the specific table column from the data source you would like to use.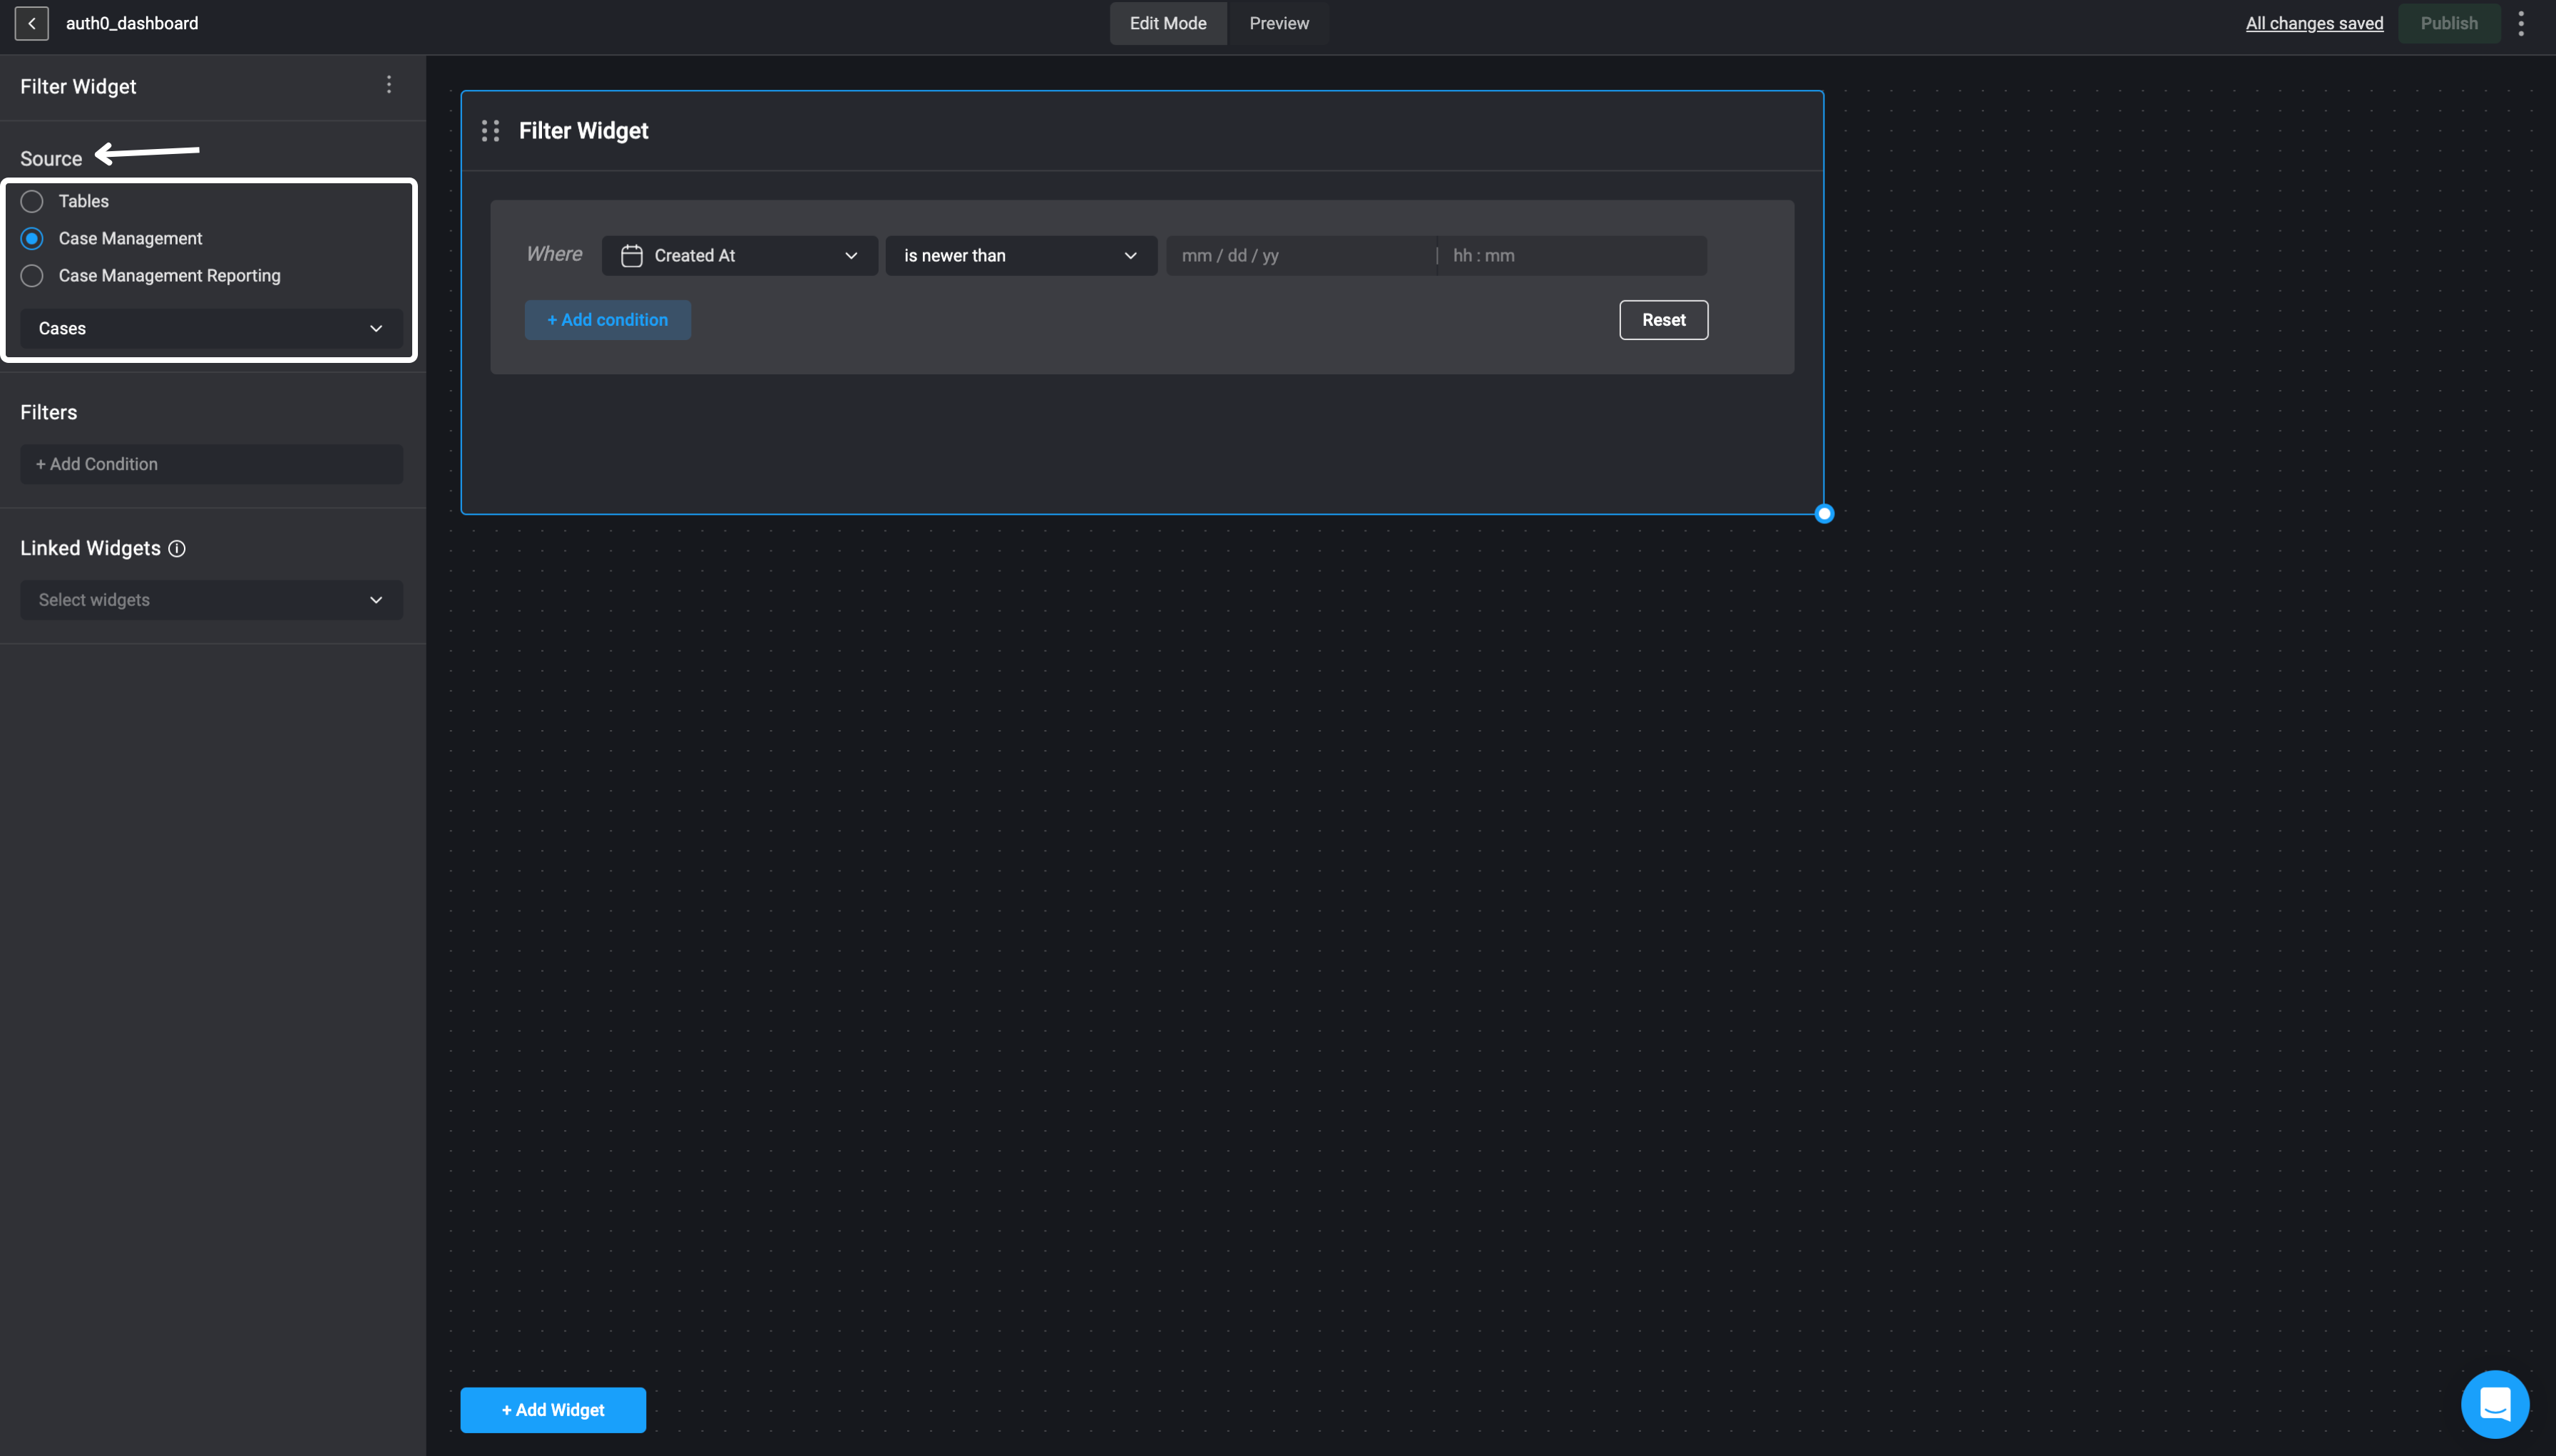
4
Define Filter Conditions
Under the Filters section, click on “add condition(s)” to add conditional statements by using the condition builder.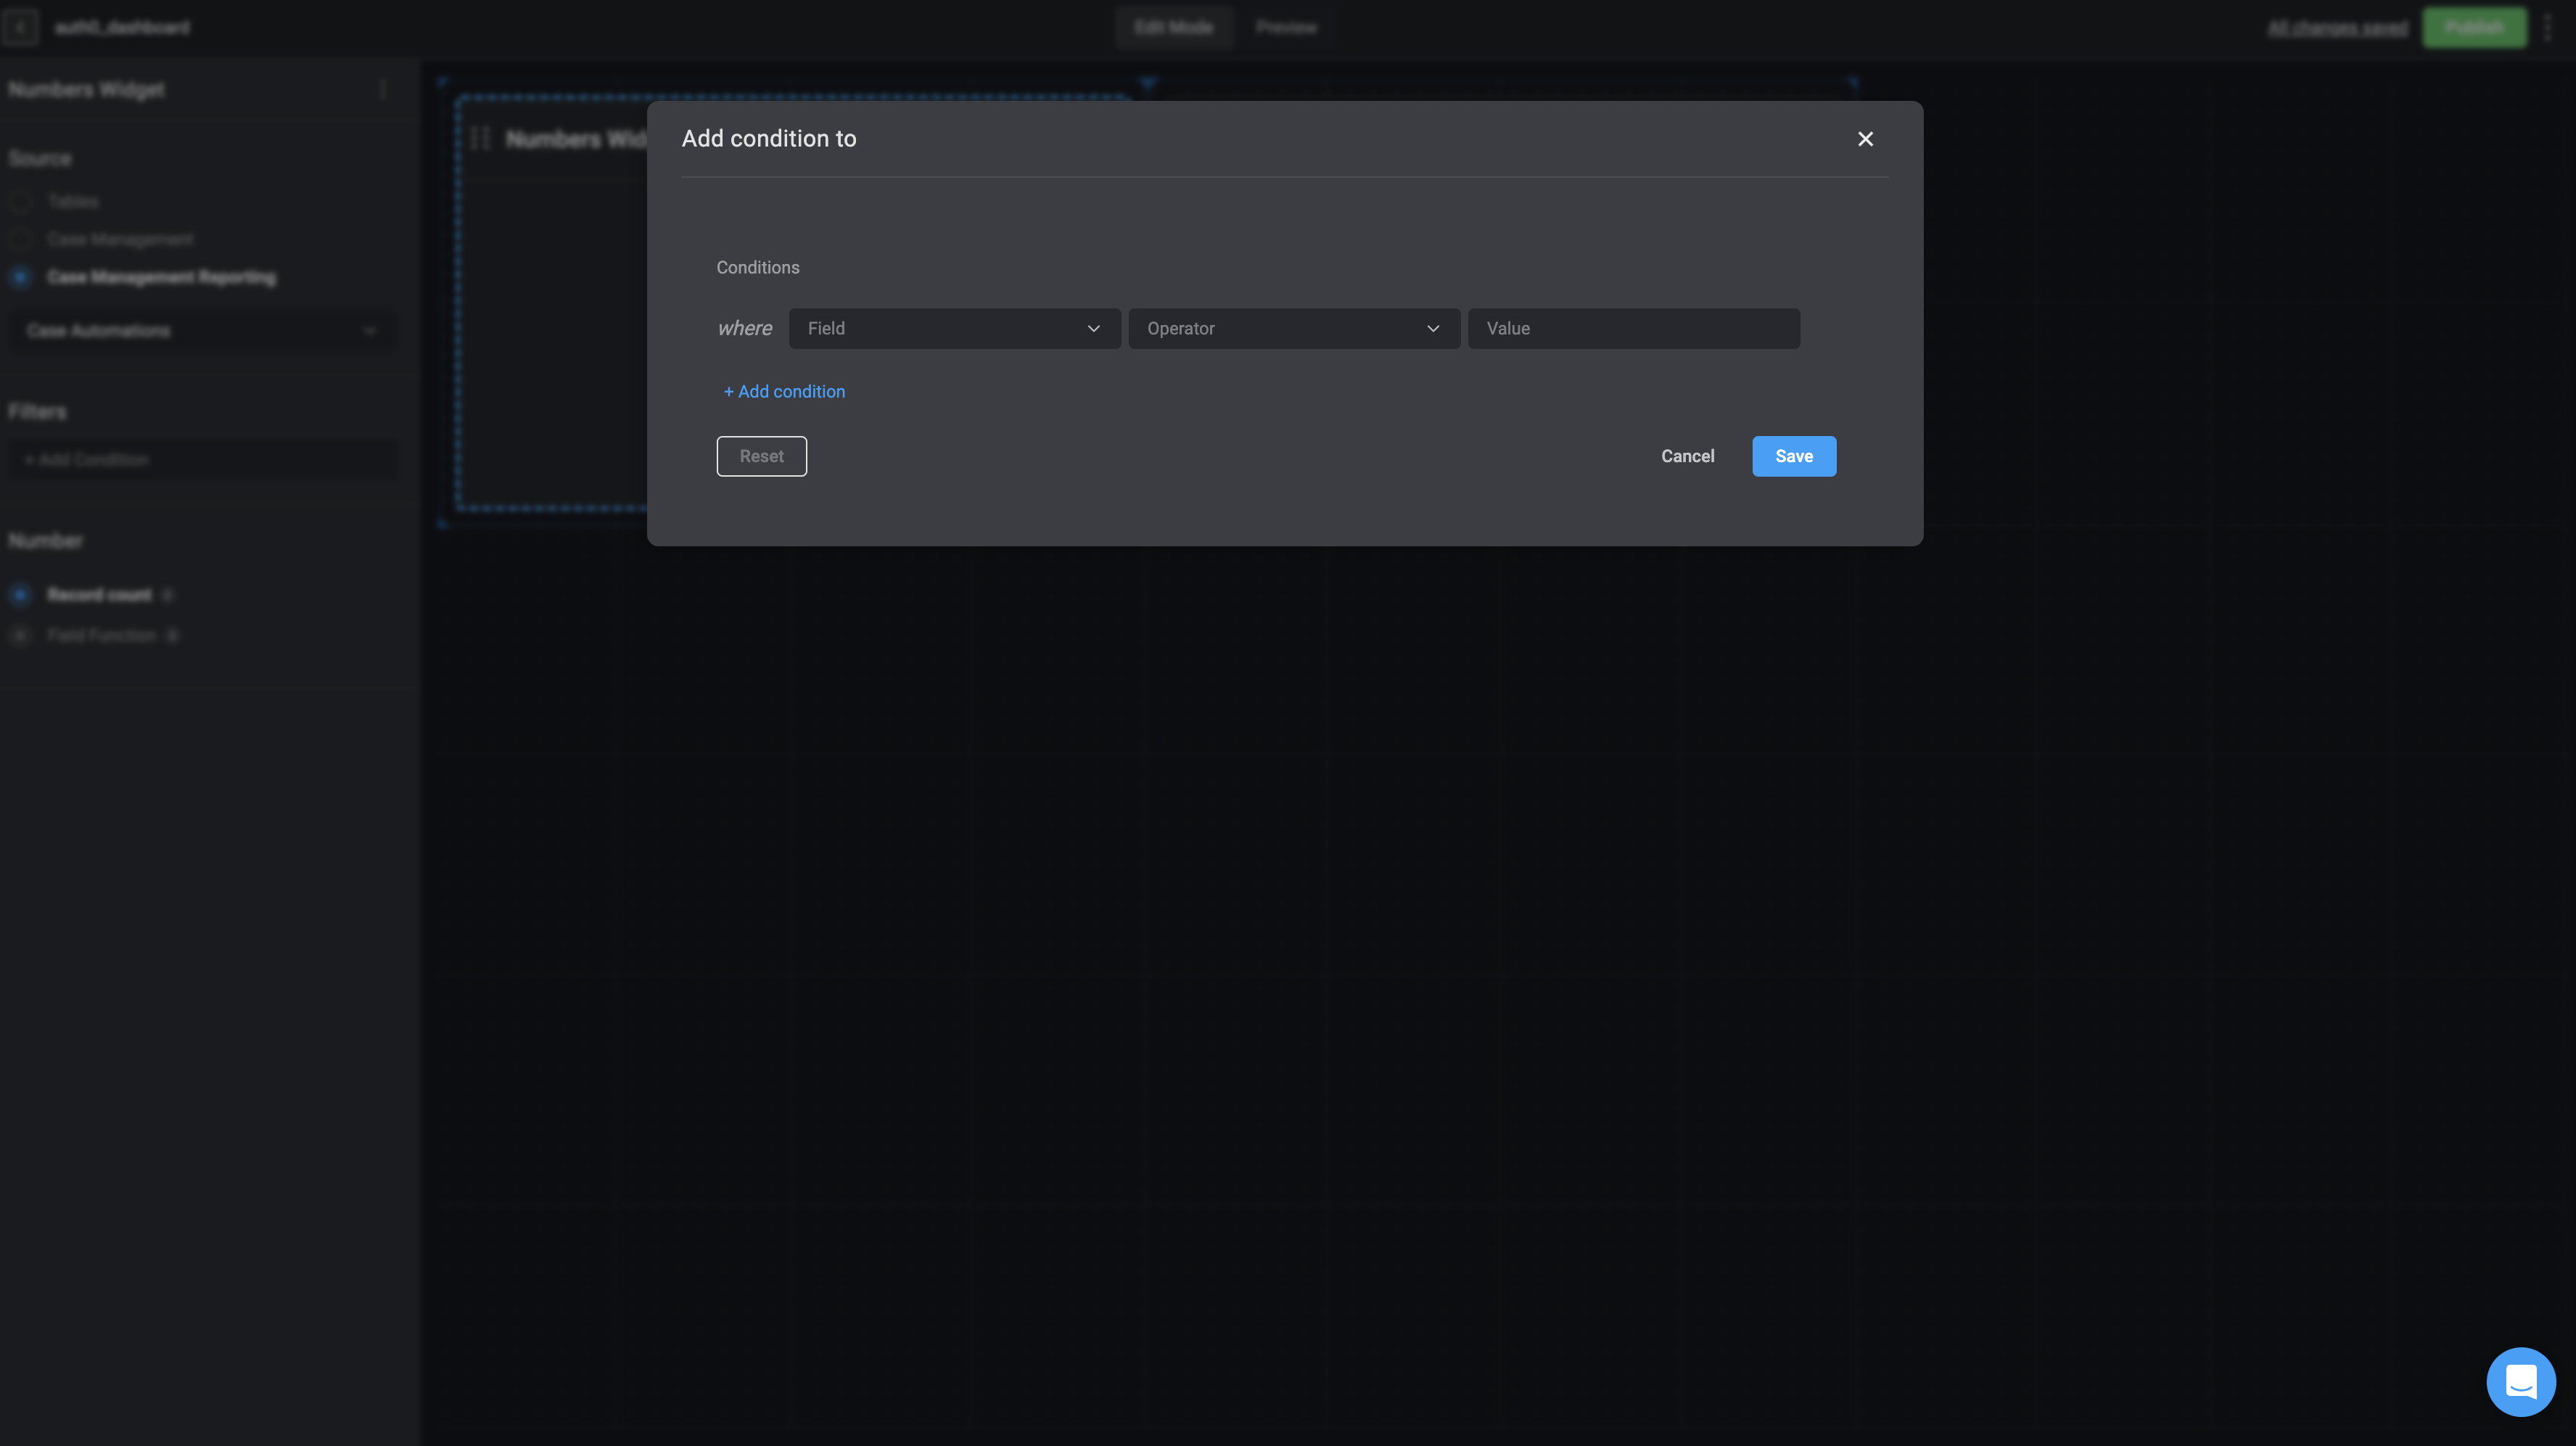
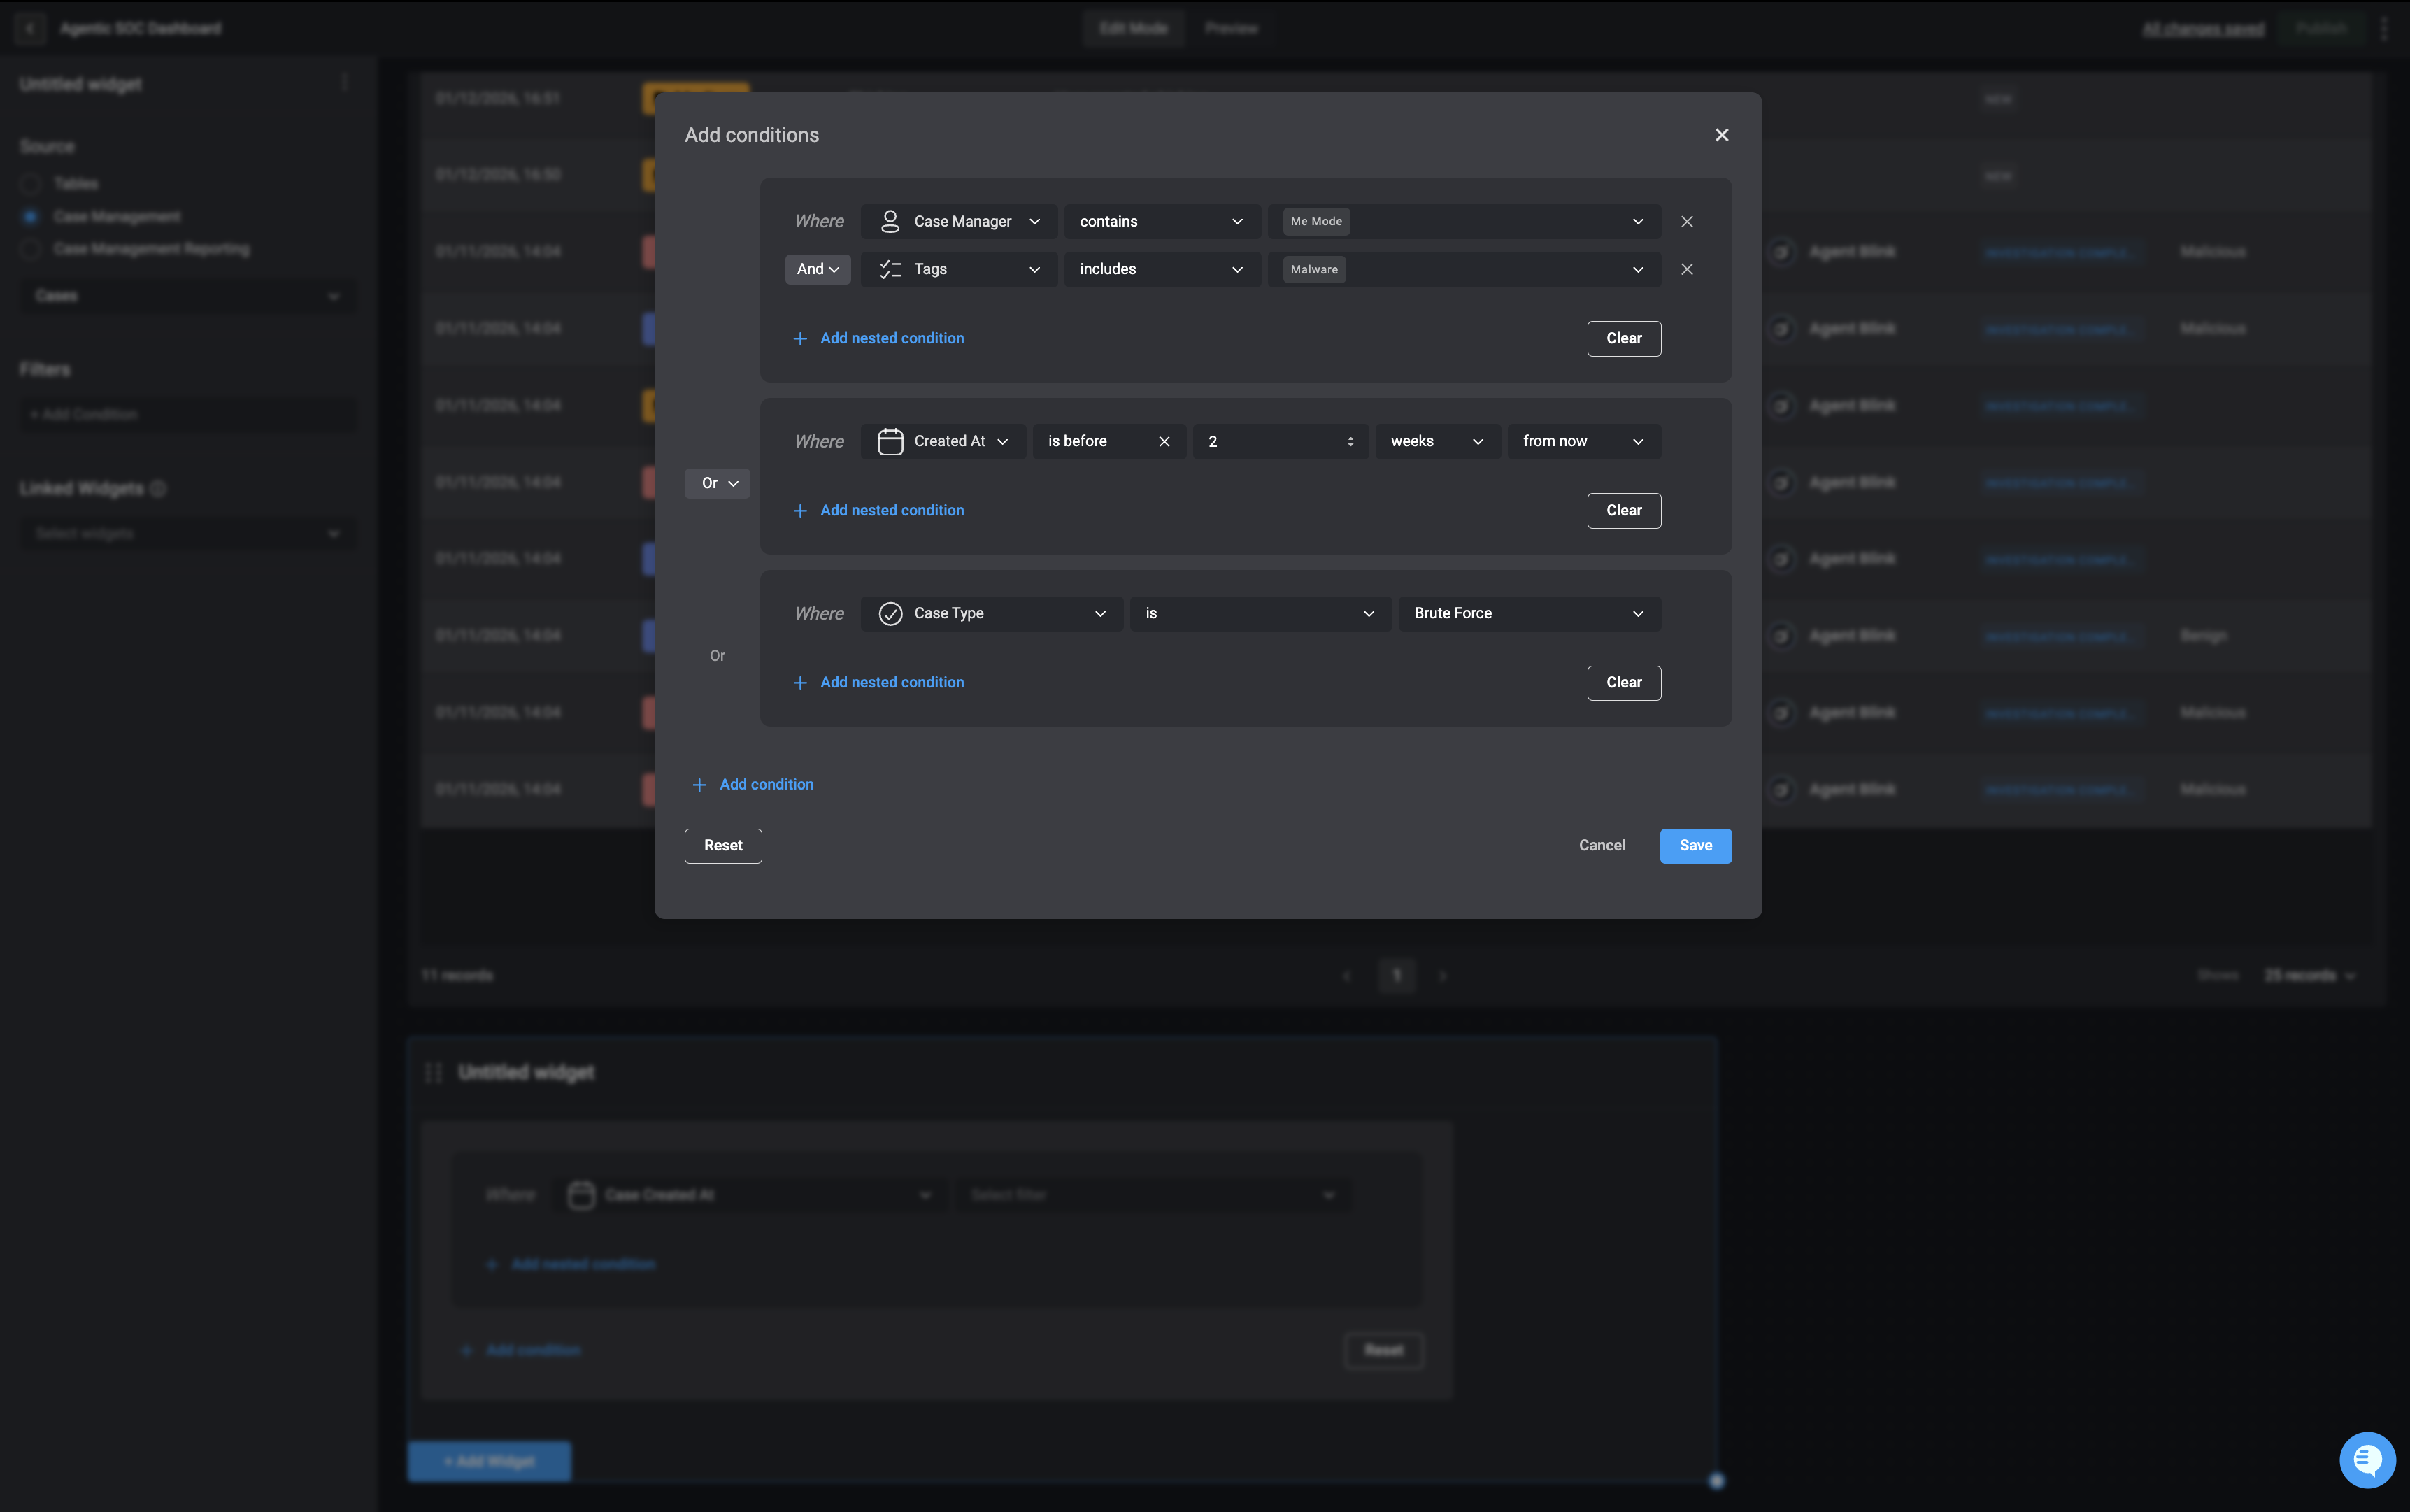
Nested Conditions
You can also create nested conditions, which are conditions grouped within other conditions. Nested conditions allow you to define more complex logic, applying specific operators (AND/OR) to a subset of conditions independently from the main group.5
Connect Filter to Target Widget
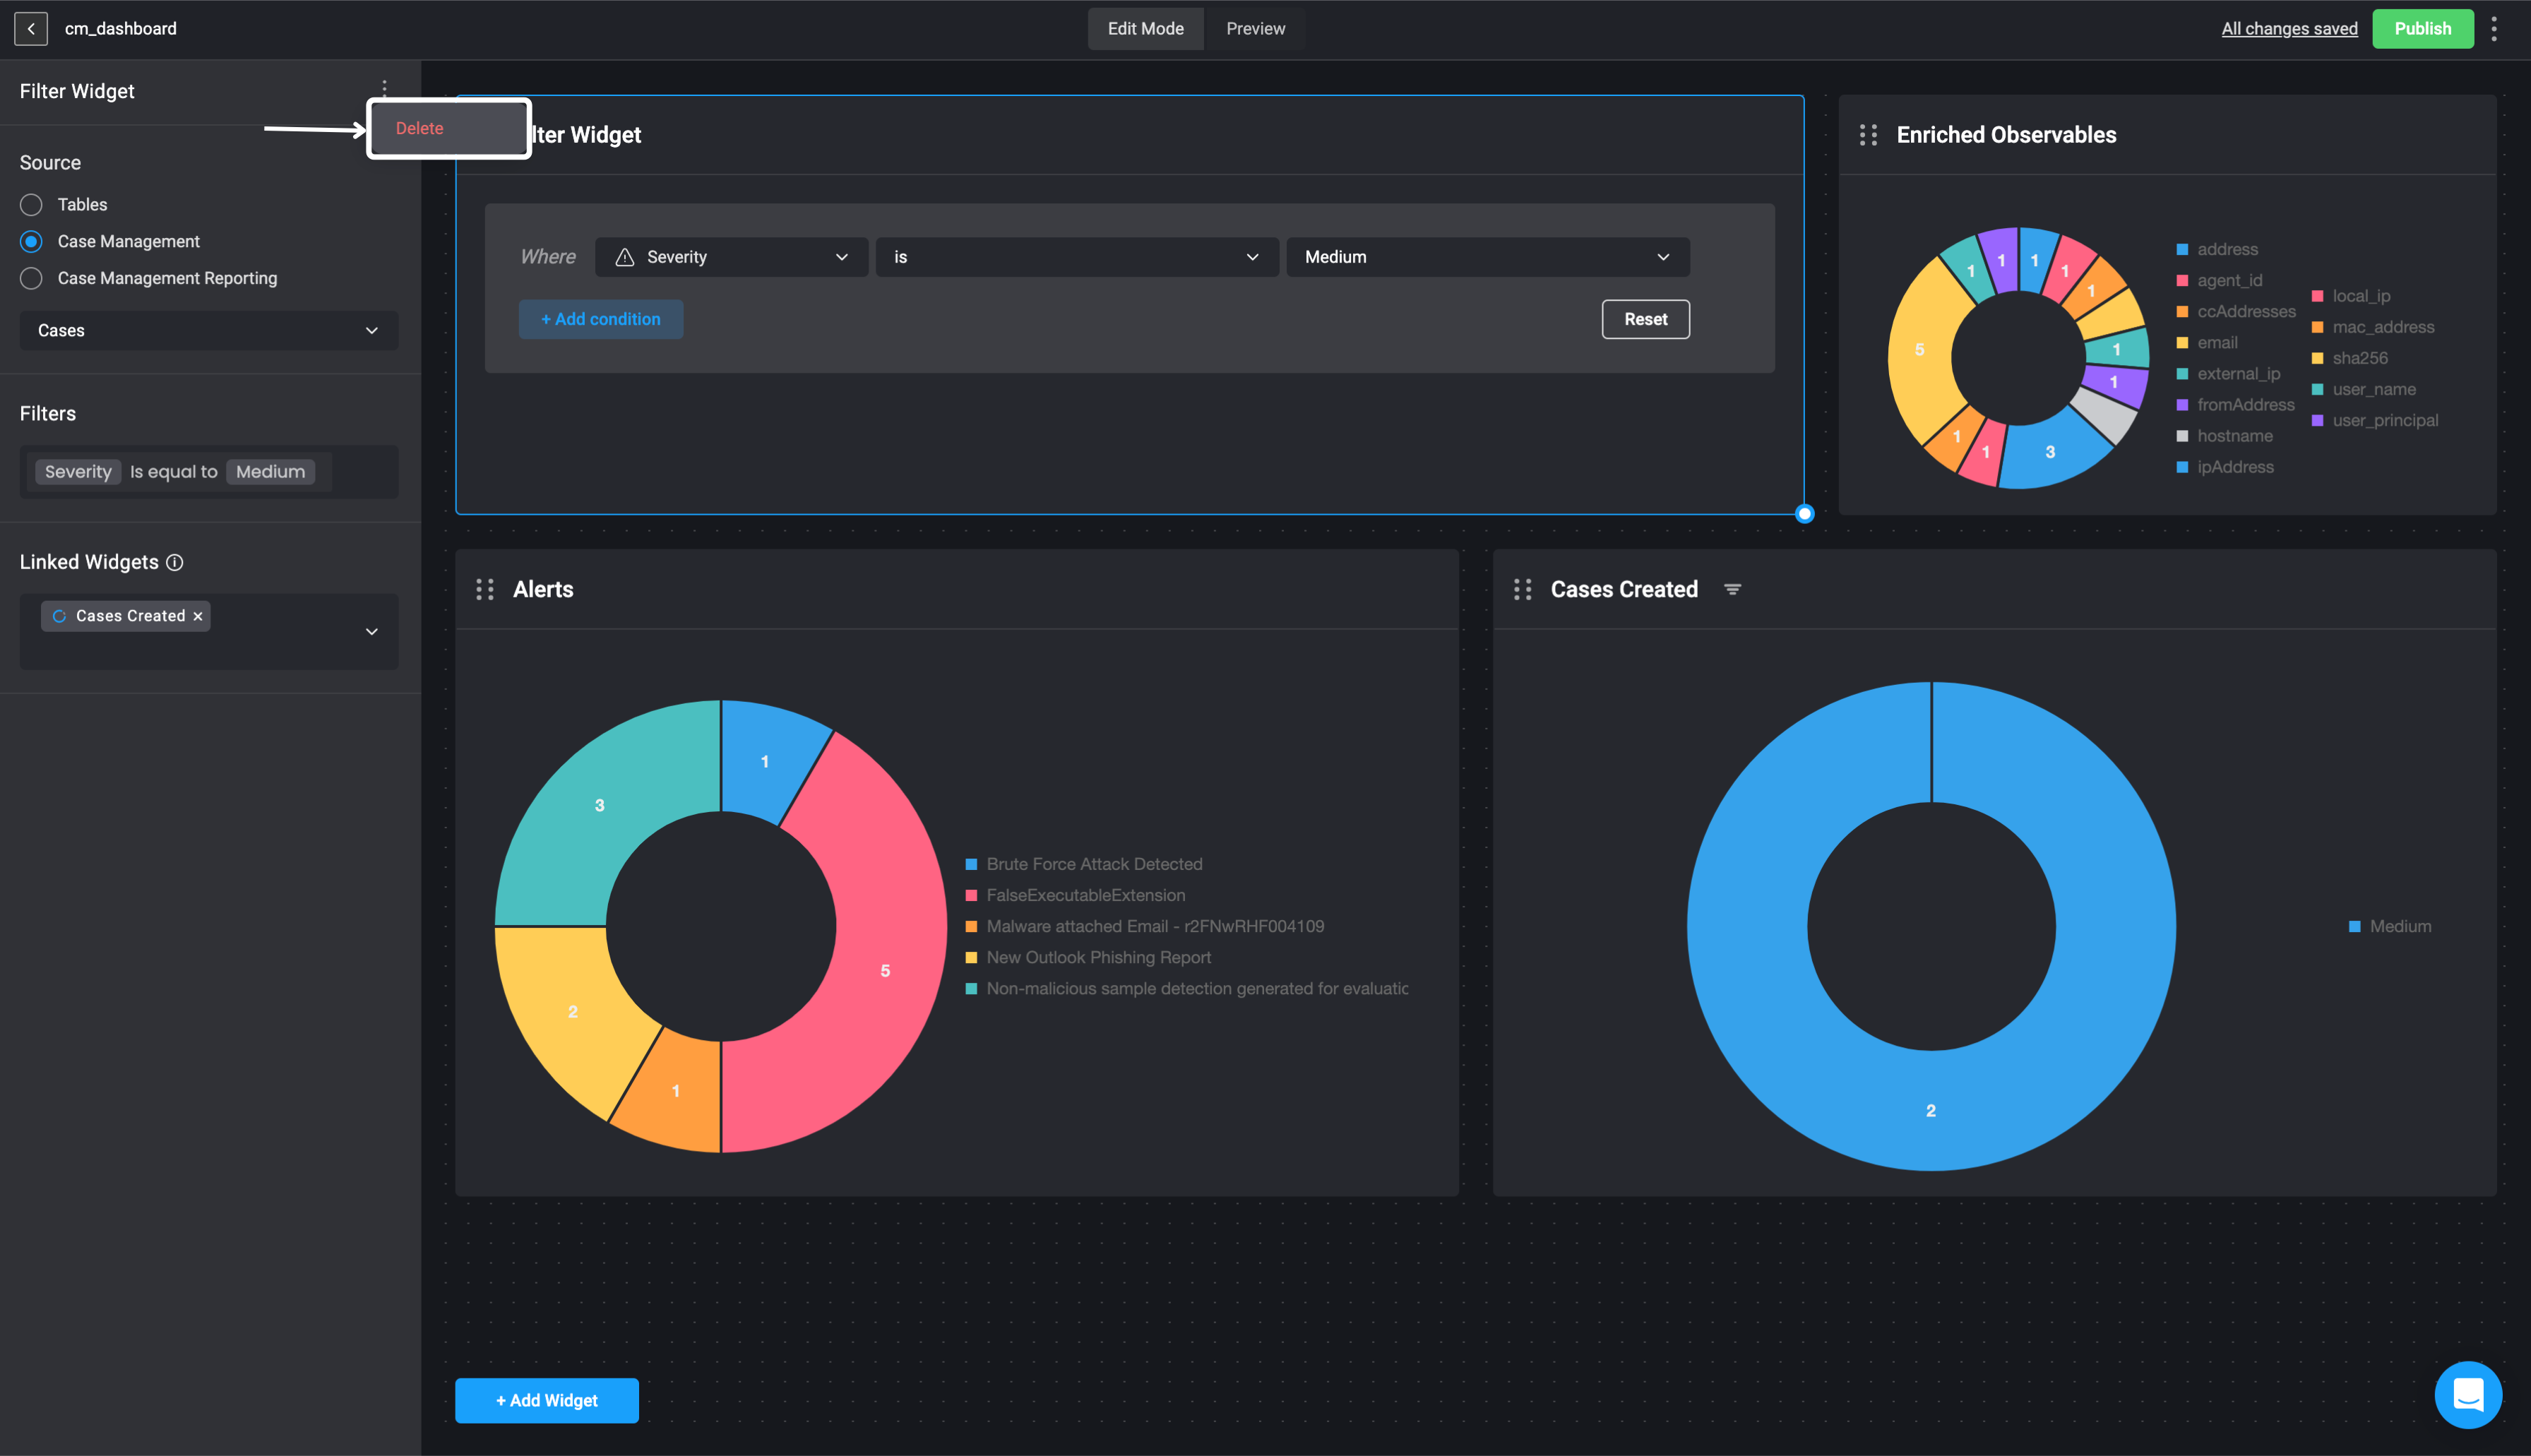
Lastly, connect your Filter Widget to the widget you want to filter. In the following example, the filter widget is connected to a bar graph displaying case data. The filter is set to show only cases with a “medium” severity level, demonstrating how the widget updates to reflect the applied filter.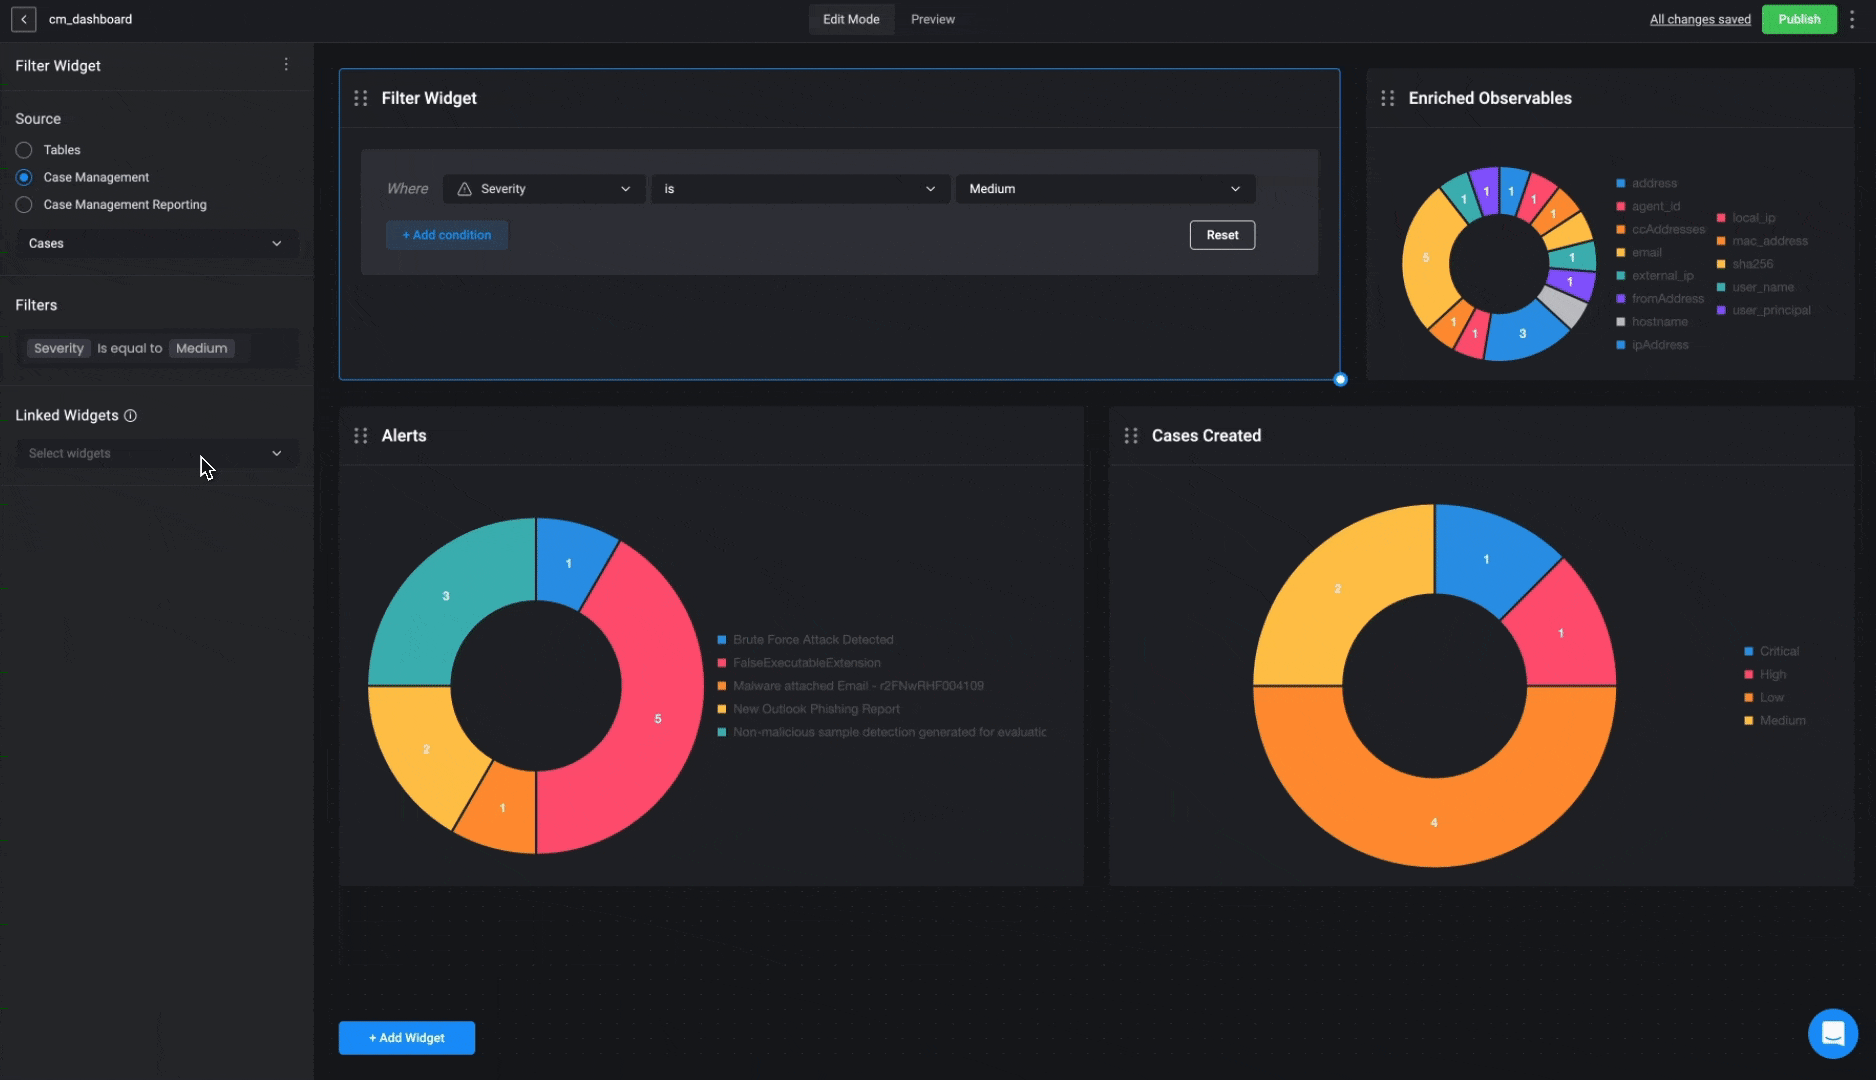
Editing the Filter Widget
1
Making Changes to the Filter Widget
If you want to remove a conditional statement and stop the filter from being applied to the linked widget, click the Reset button. For any other changes, you can edit directly in the left-hand sidebar. Simply locate the relevant section to adjust or update the information as needed. Changes will be applied automatically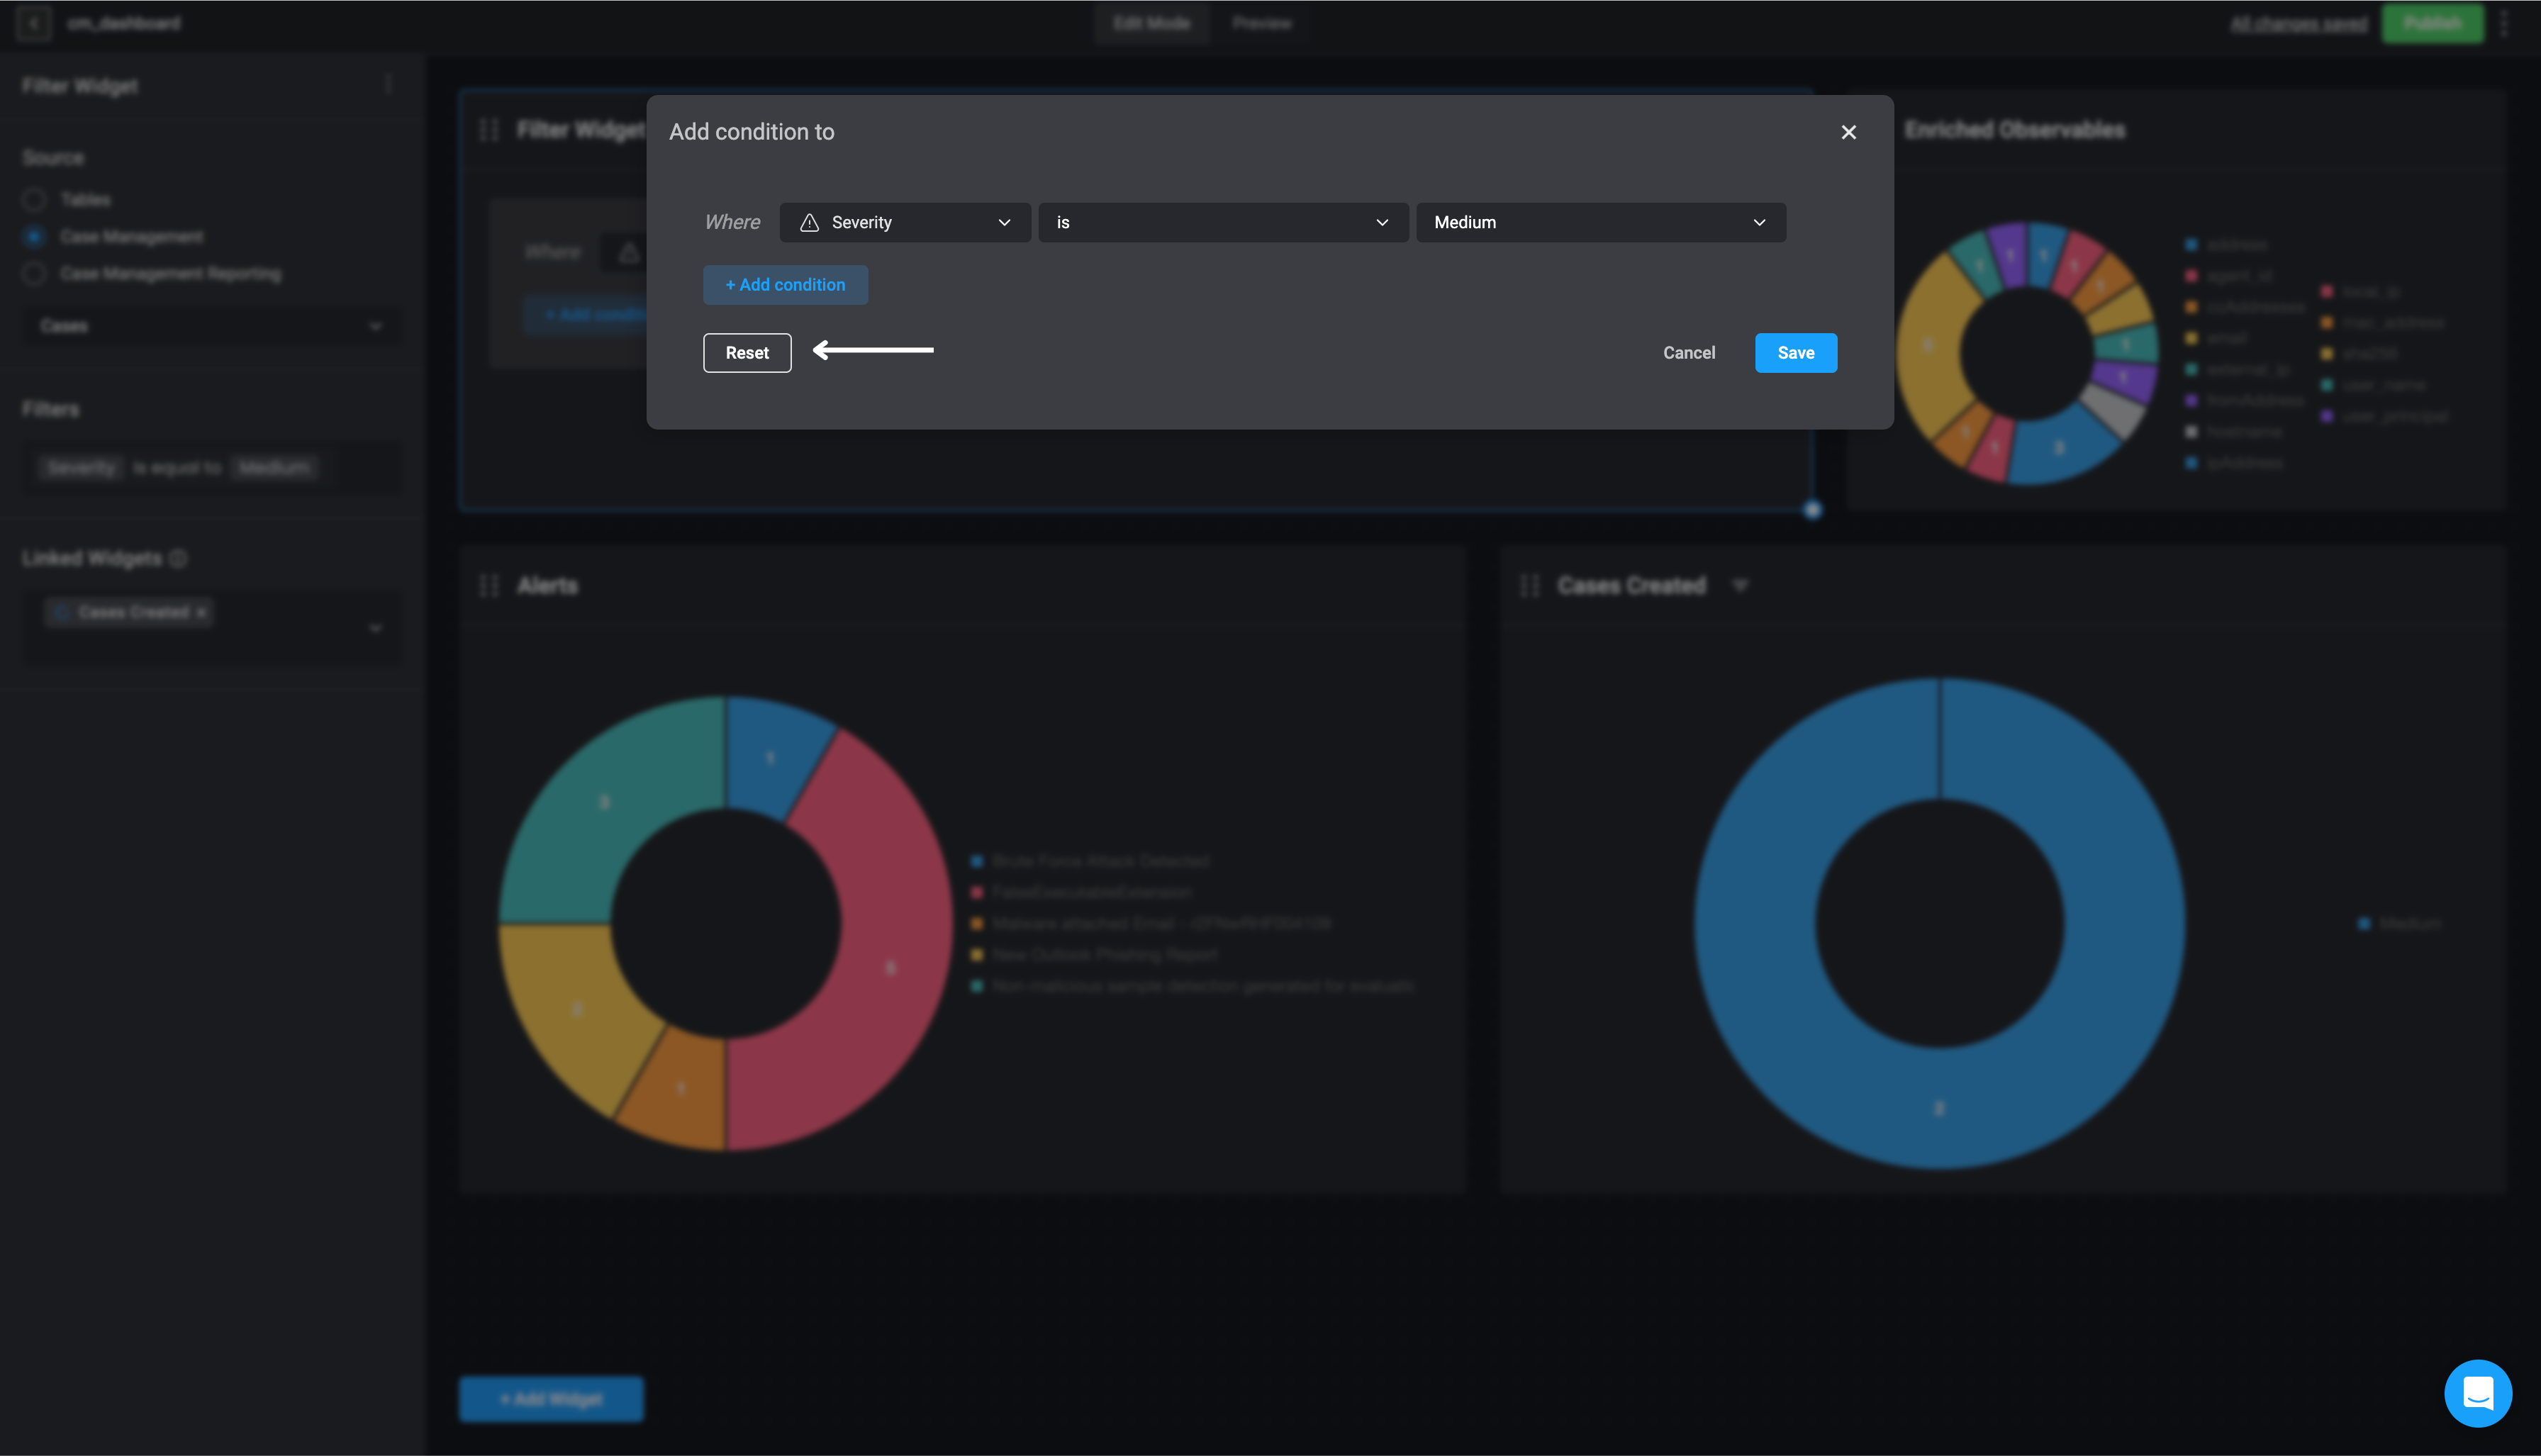
Deleting a Filter Widget
1
Open Widget Options
In the left-hand sidebar, click the icon in the top-right corner and then select the delete button.
2
Confirm Widget Removal
The Filter widget will be removed from your Dashboard Building Interface.