Note: Audit logs are retained for a duration of 30 days.
- Approval management
- Cases
- Case related tables
- Connections
- Dashboards
- Global variables
- Runners
- Self-service apps
- Tables
- Tenant admin settings
- Tenant user management
- Users
- Workflows
- Workspace management
The audit logs do not track changes to data or content, such as workflow action updates, workflow executions, modifications to table records, or changes to cases.
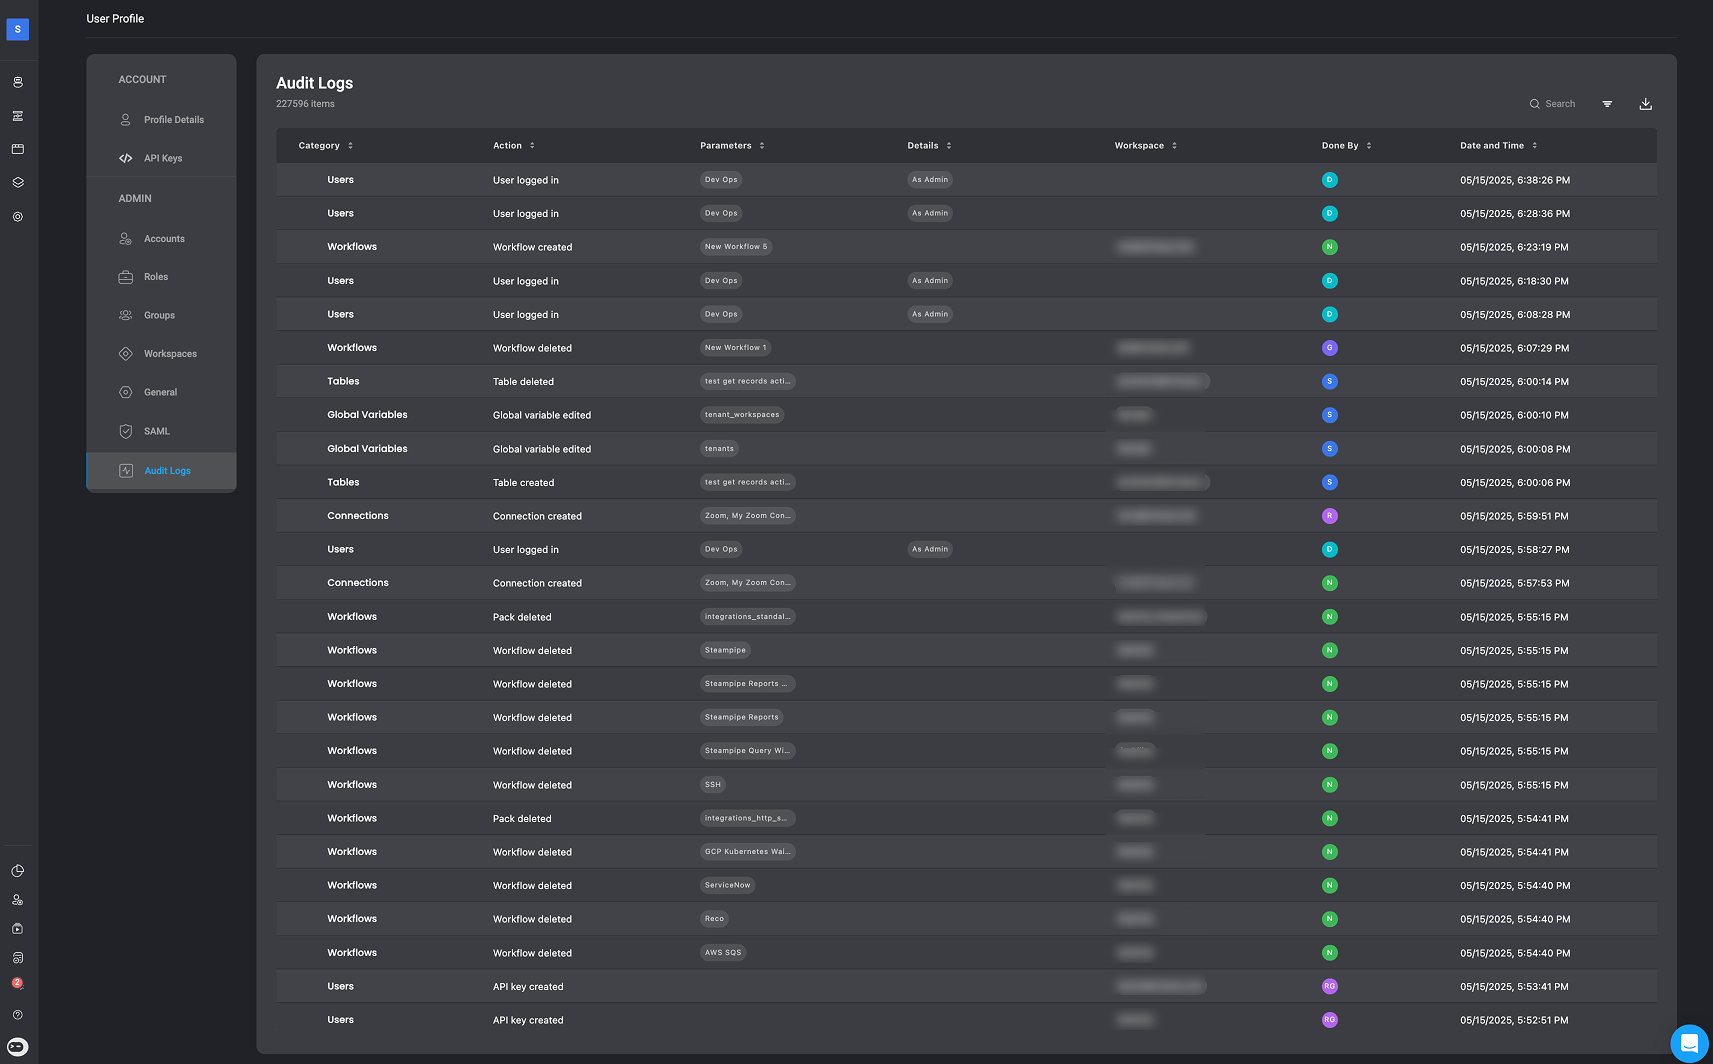
Audit Log Table Content
Each log entry includes the following information:- Category – The general type of activity: Setting updates, System configuration, or User actions.
- Action – The specific action that occurred.
- Parameters – Key data relevant to the action, such as the affected username, Workflow name, or API endpoint.
- Details – Additional context or information about the action.
- Workspace – The name of the workspace where the action took place.
- Done by – The email address of the user who initiated the action.
- Date and Time – When the action was performed.
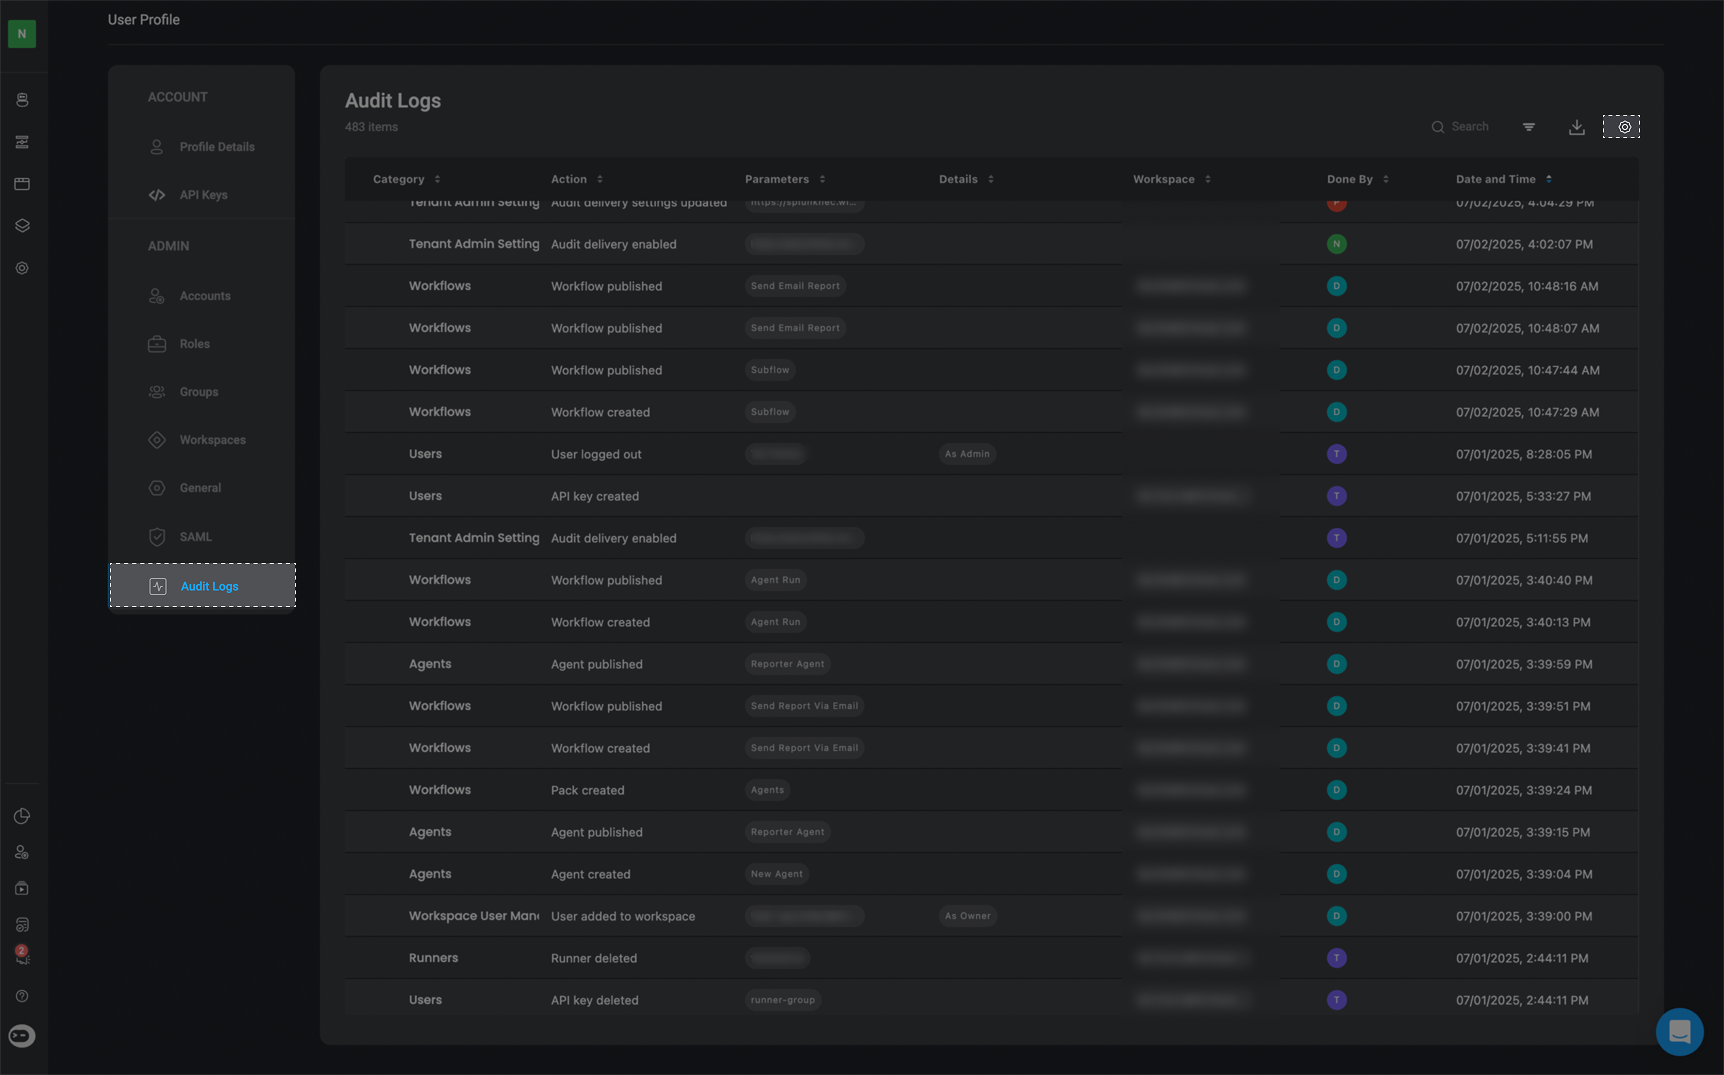
Categories and Events
In the following section, you can find a complete overview of Blink’s audit log categories and the types of events captured within each. Audit logs in Blink are designed to give you full visibility into user activity, system changes, and workflow executions across the platform.Audit Log Categories and Events
Audit Log Categories and Events
Approval Management
Cases
Case Related Tables
Case related tables refer to all tables in Case Management including: the Cases Table, Alerts Table, Observable Table, Attachments Table,Tasks Table or your own Custom Table created in Case Management
Connections
Dashboards
Global Variables
Runners
Self-Service Apps
Tables
Tenant Admin Settings
Tenant User Management
Users
Workflows
Workspace Management
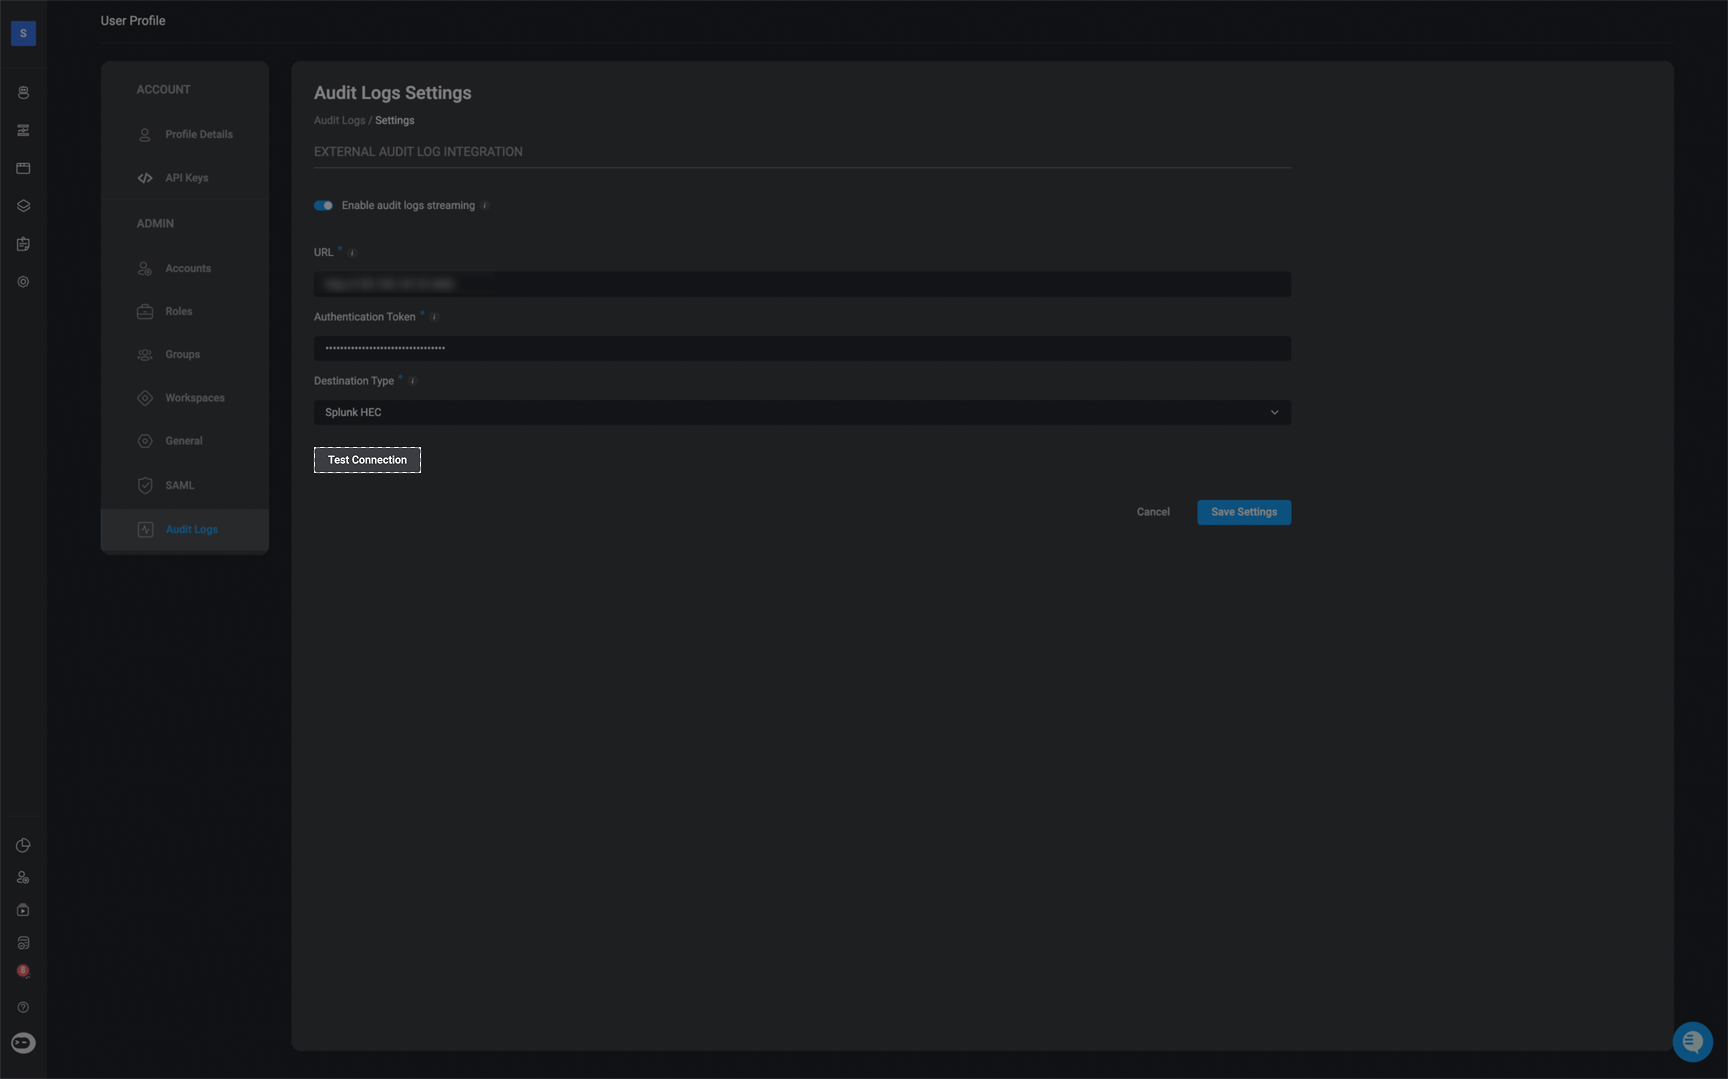
External Audit Log Integration
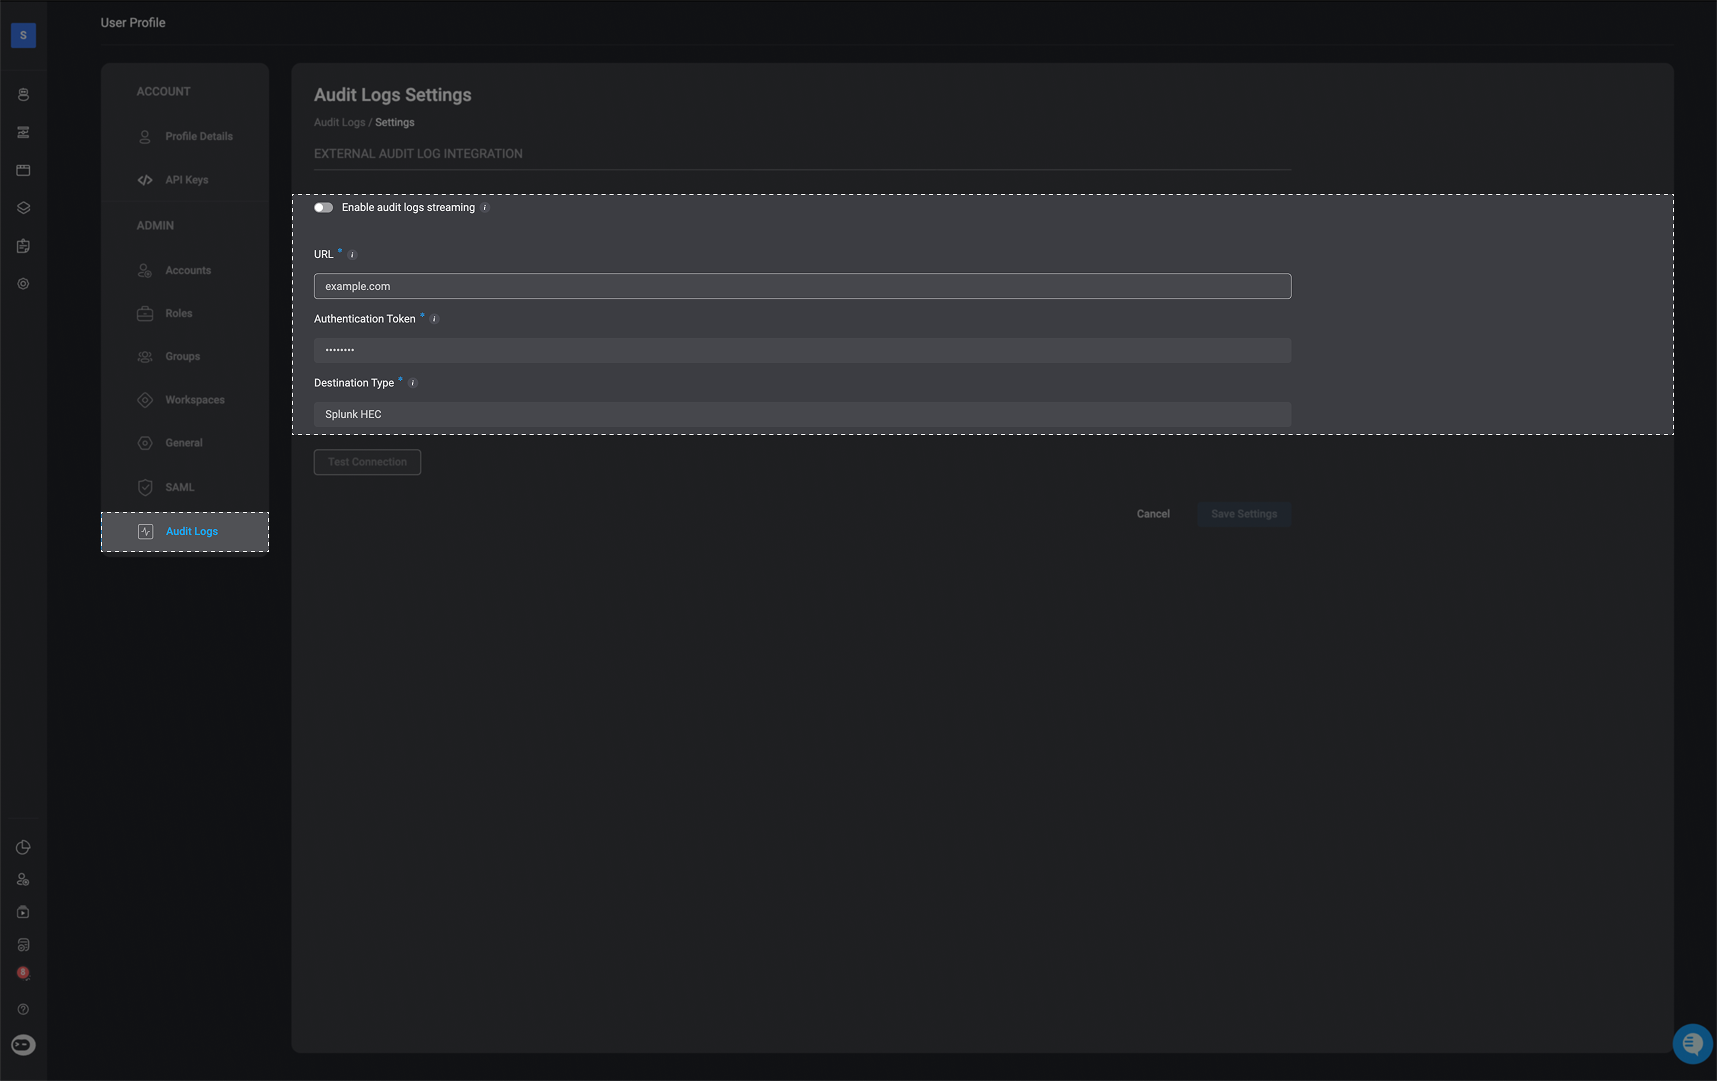
Blink supports native audit log streaming to external SIEM systems, allowing organizations to integrate Blink audit data into tools like Splunk or Elasticsearch. This feature gives security teams greater visibility and control by centralizing audit logs for compliance, monitoring, and incident response without the need for manual exports. Tenant admins can configure their SIEM endpoint directly in Blink, test the connection, and begin streaming audit logs in real time.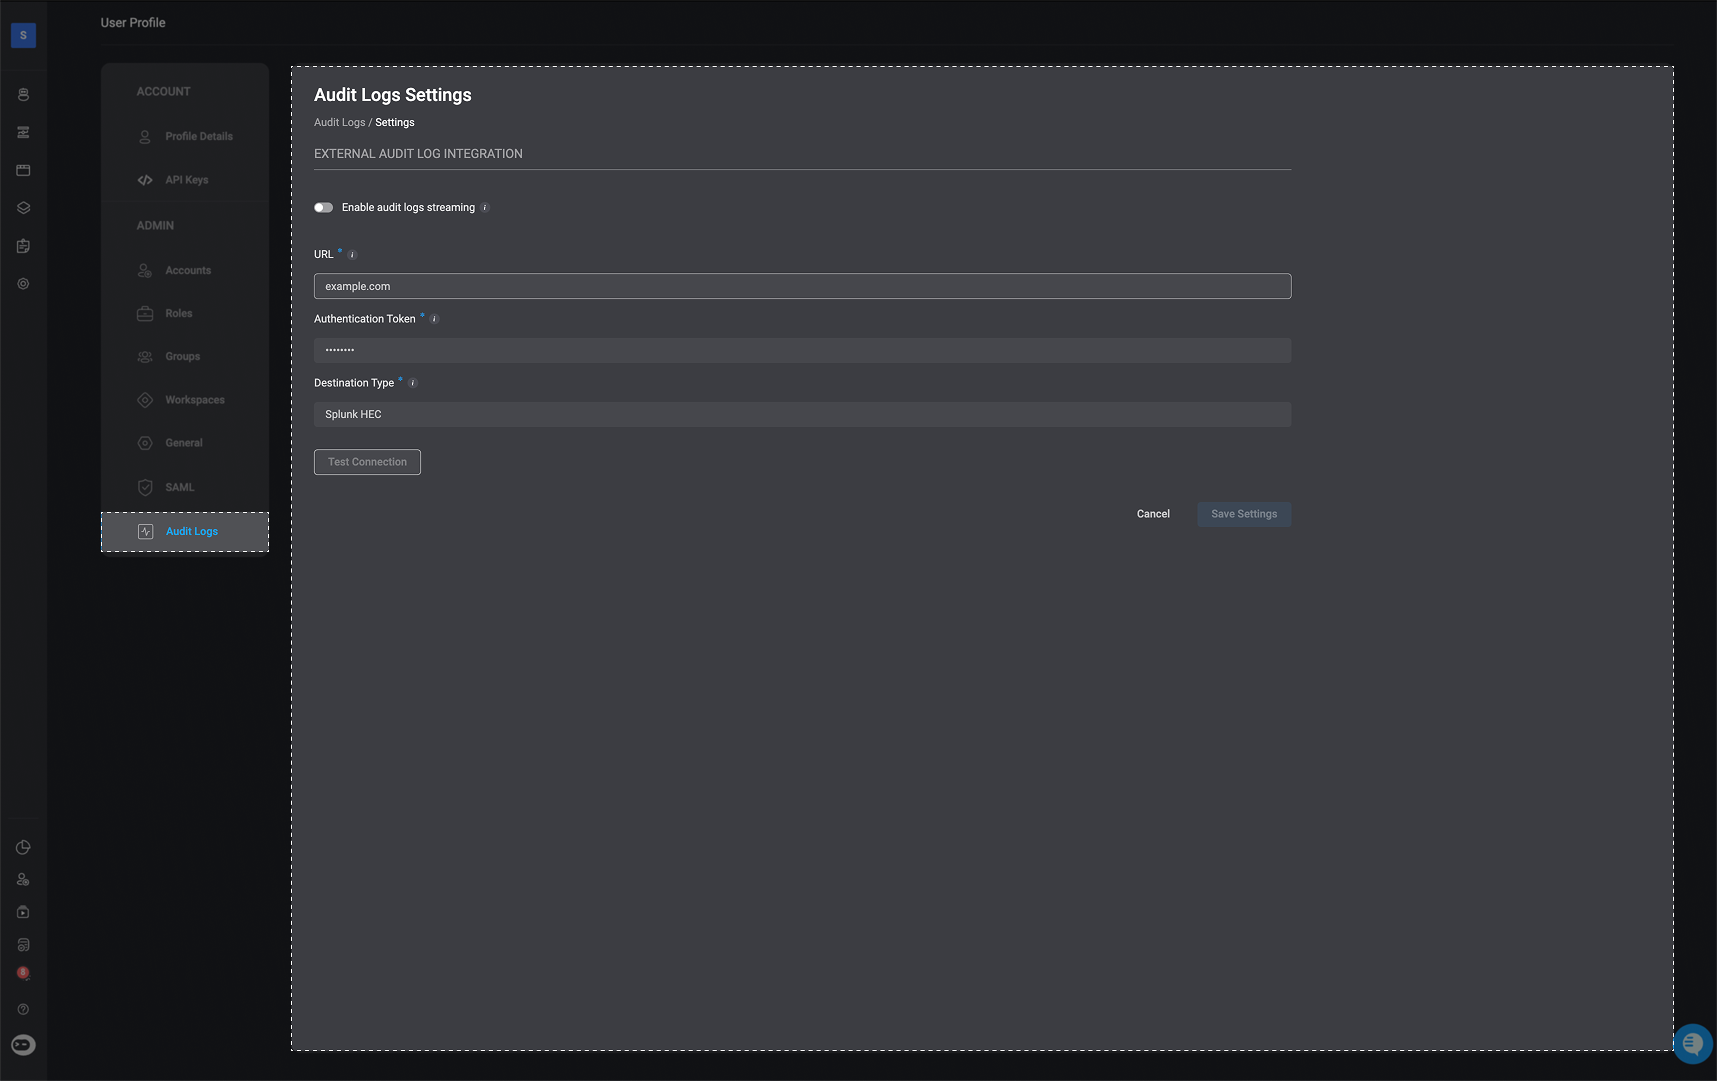
1
Navigate to the 'Audit Log Settings' page
In the top right-corner of the Audit Log page, select the icon
2
Enter the Required Parameters
-
Enable audit log streaming:
- When enabled, audit logs will be delivered to your specified external destination in real time.
- Disabling this will stop all log delivery and deactivate the form below.
-
URL:
- The destination URL for your external logging service.
This must be a reachable HTTPS endpoint that supports log ingestion.
- The destination URL for your external logging service.
-
Authentication Token:
- A token or API Key used to authenticate requests to your external logging endpoint. This is required for secure delivery of audit logs.
-
Destination Type- Select the type of destination where logs will be sent:
- Splunk HEC
- HTTP (Bearer Auth)
- Elasticsearch
3
Optional-Test Connection
You can verify that Blink is successfully connected to your selected SIEM platform by clicking the ‘Test Connection’ button.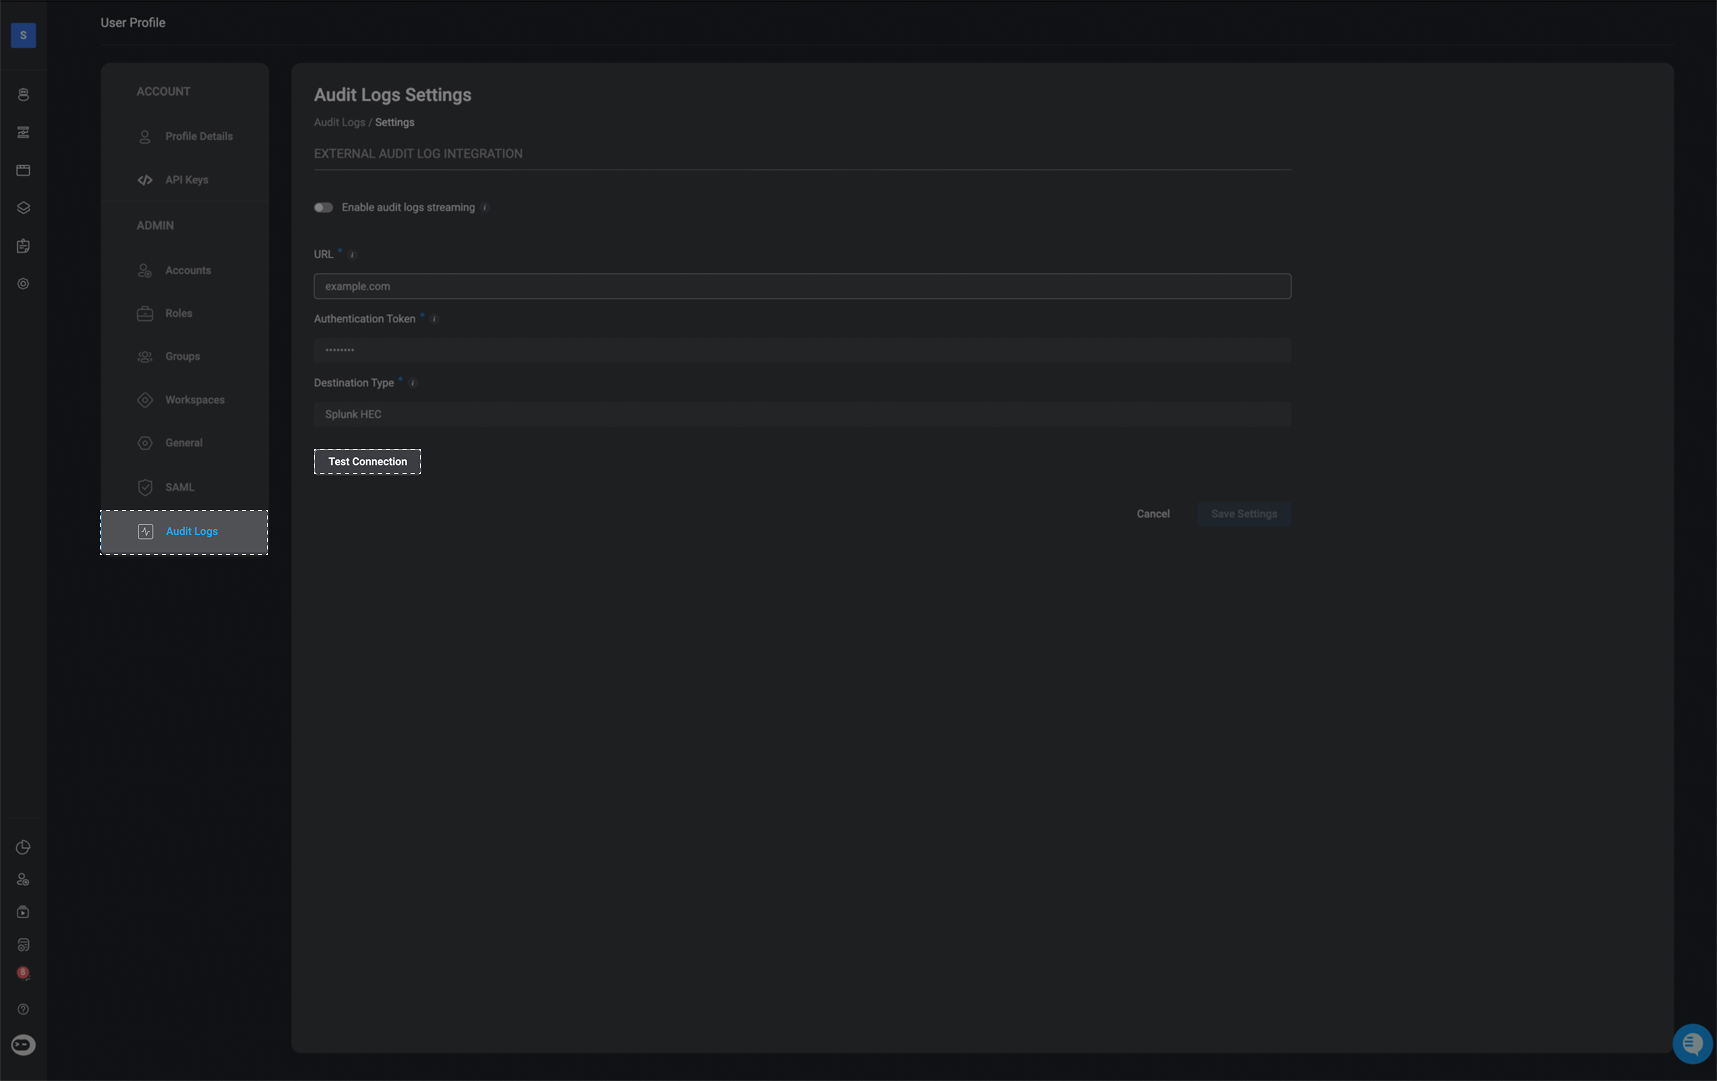
Configuration Guide: Generating a Splunk HTTP Event Collector (HEC) Token
Follow this step-by-step guide, to learn how to generate Splunk HTTP Event Collector (HEC) token, which is required for integrating Splunk with the Blink platform. This token is required to integrate Splunk with the Blink platform in order to stream Blink’s audit logs to a selected external destination.1
Access the HTTP Event Collector
Log in to your Splunk Enterprise account. In the top-right corner, click on Settings, then search for HTTP Event Collector and select it.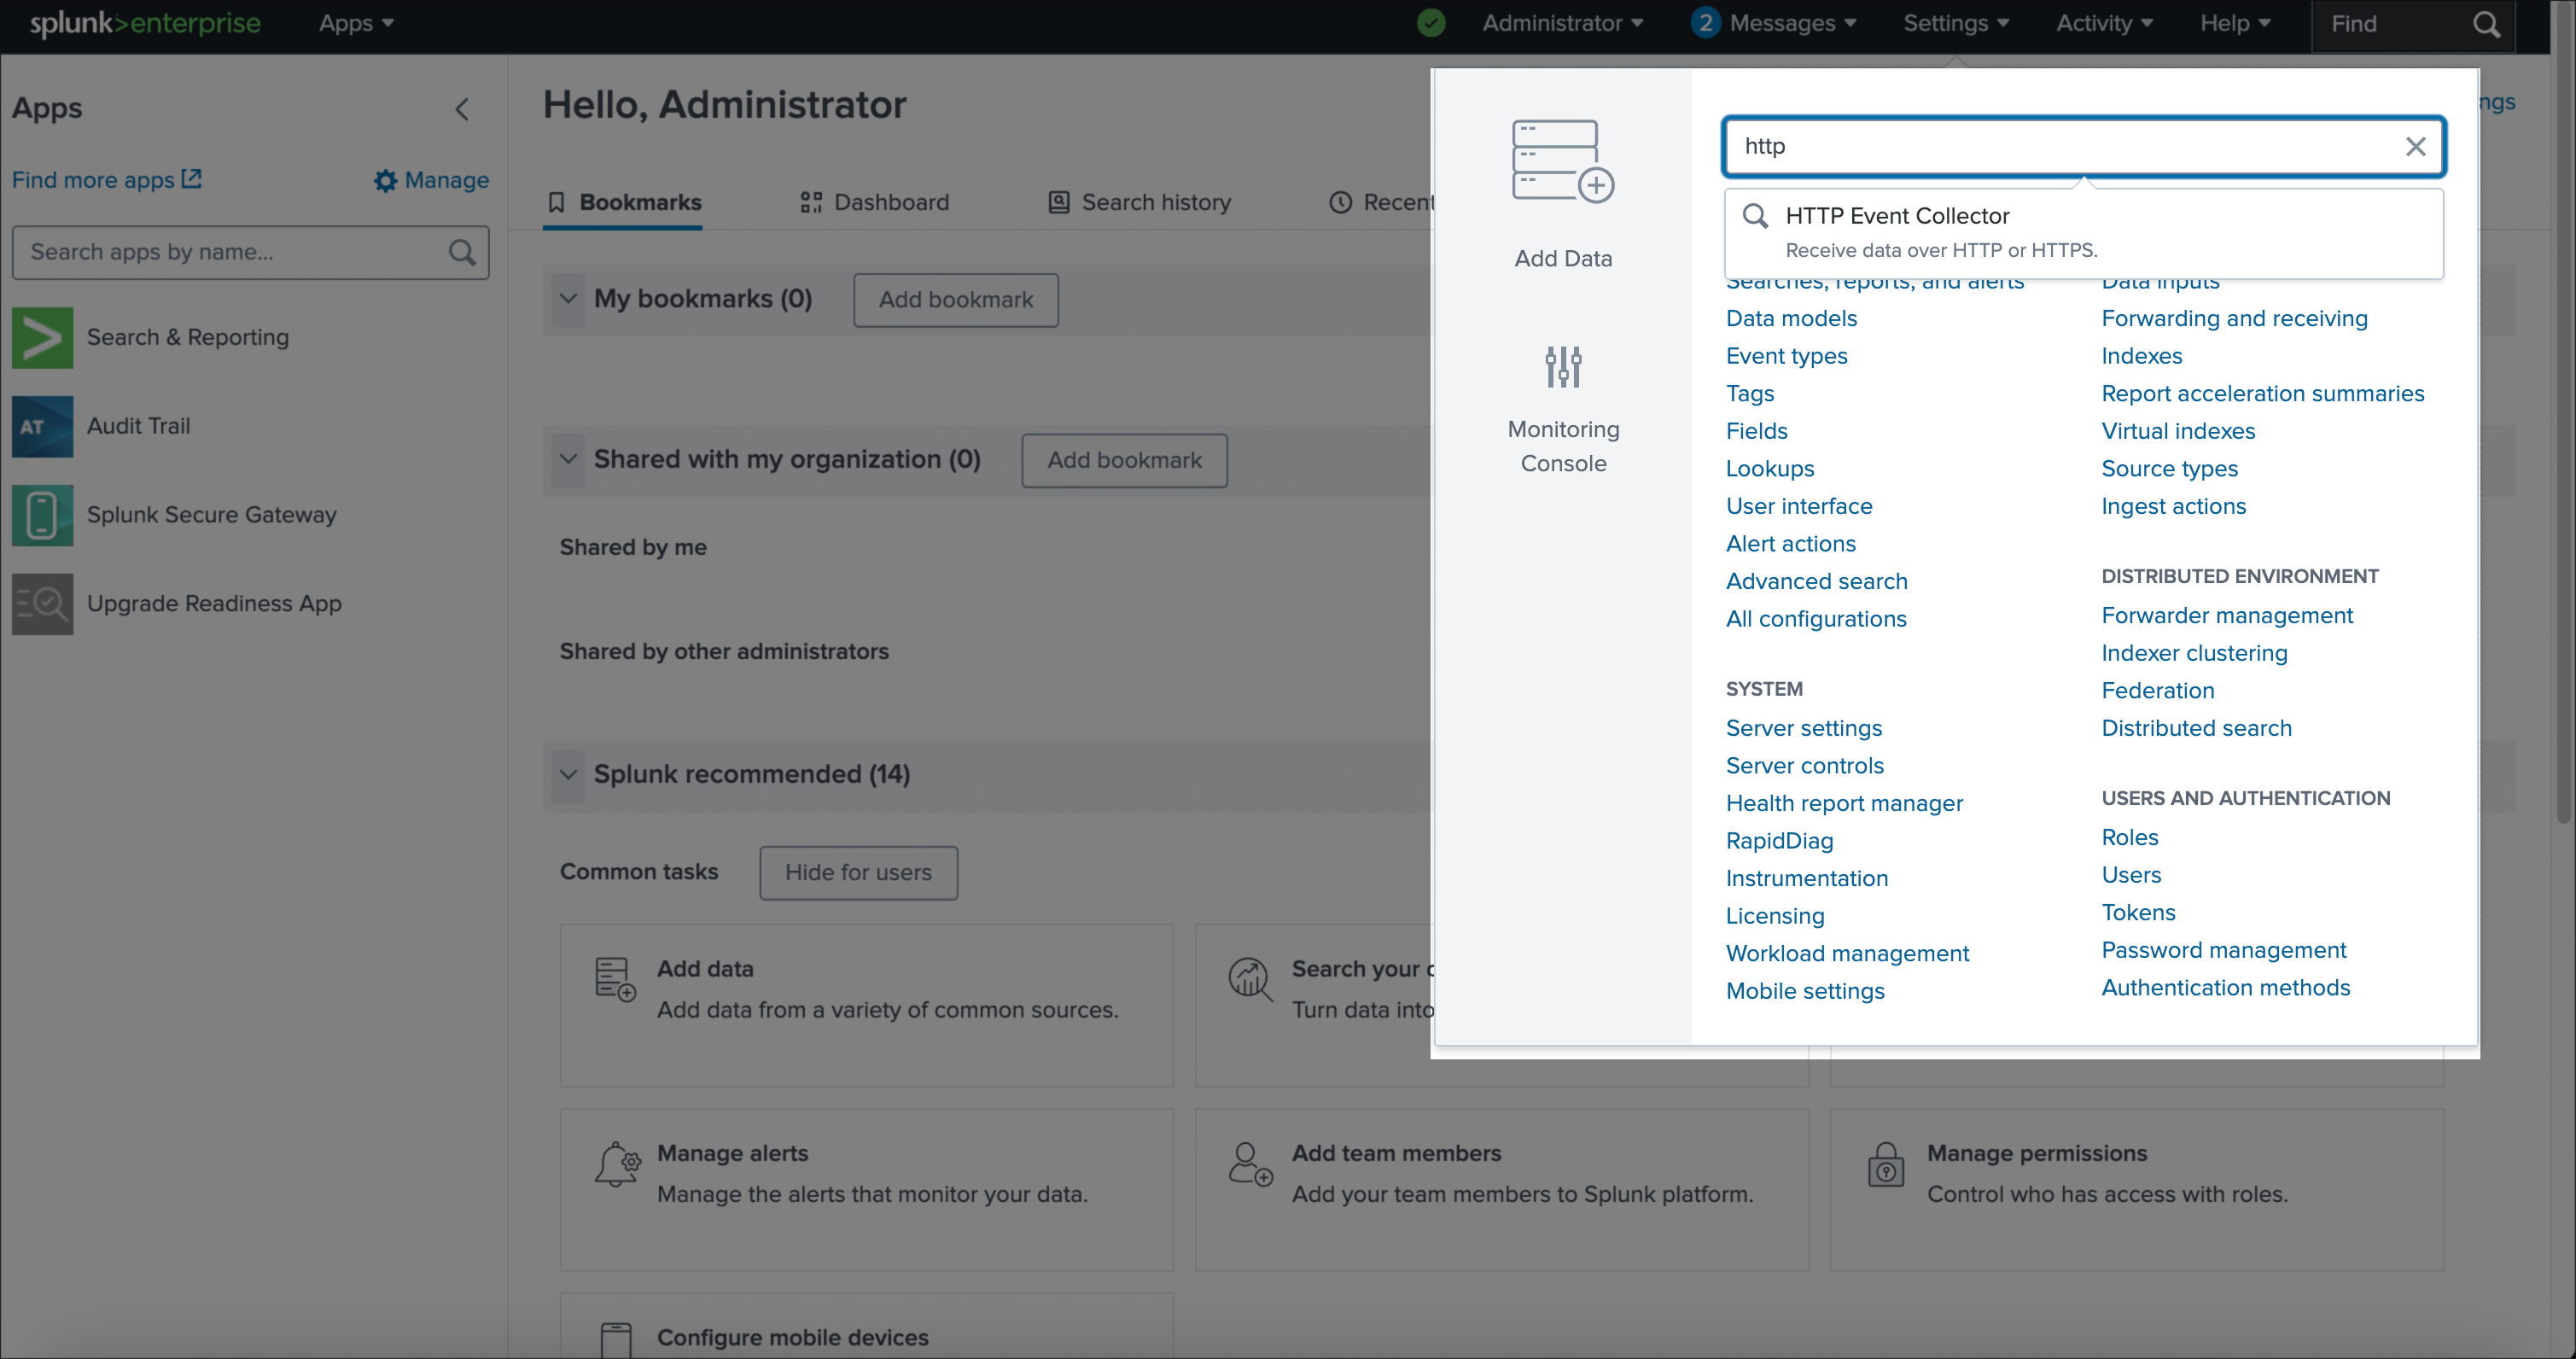
2
Select Source
Fill in all required fields for the data source configuration.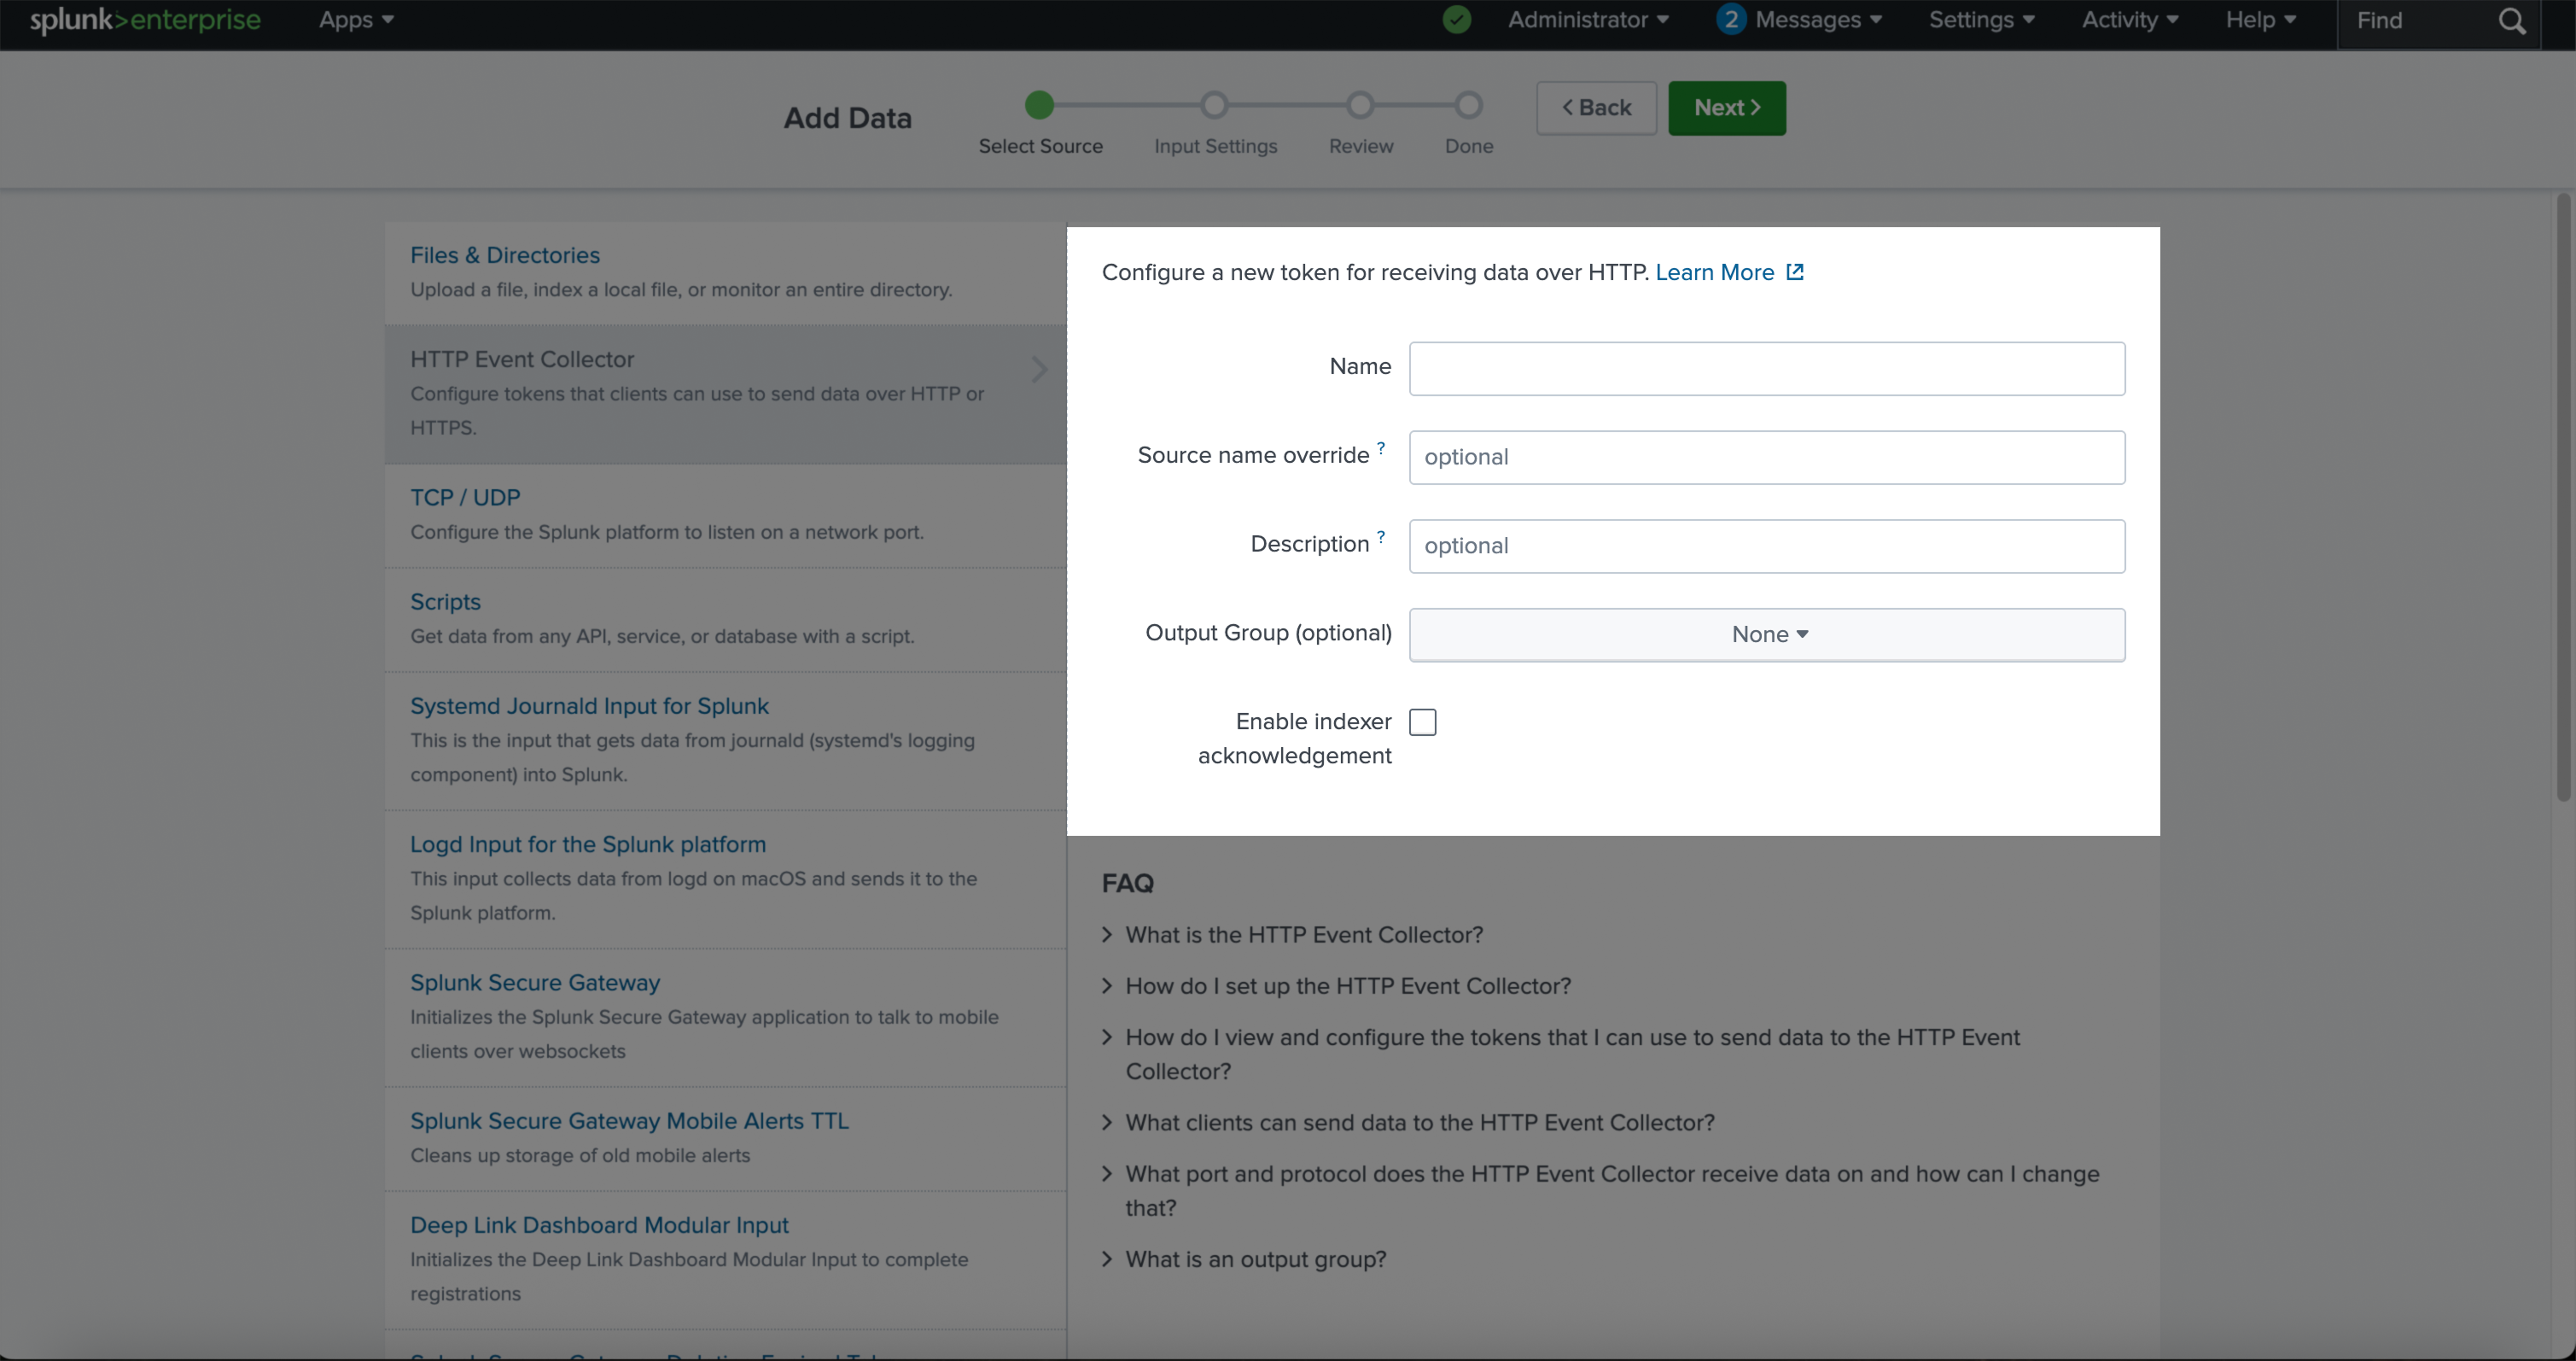
3
Input Settings
Choose the appropriate indexes that the ‘HTTP Event Collector’ token will be allowed to access.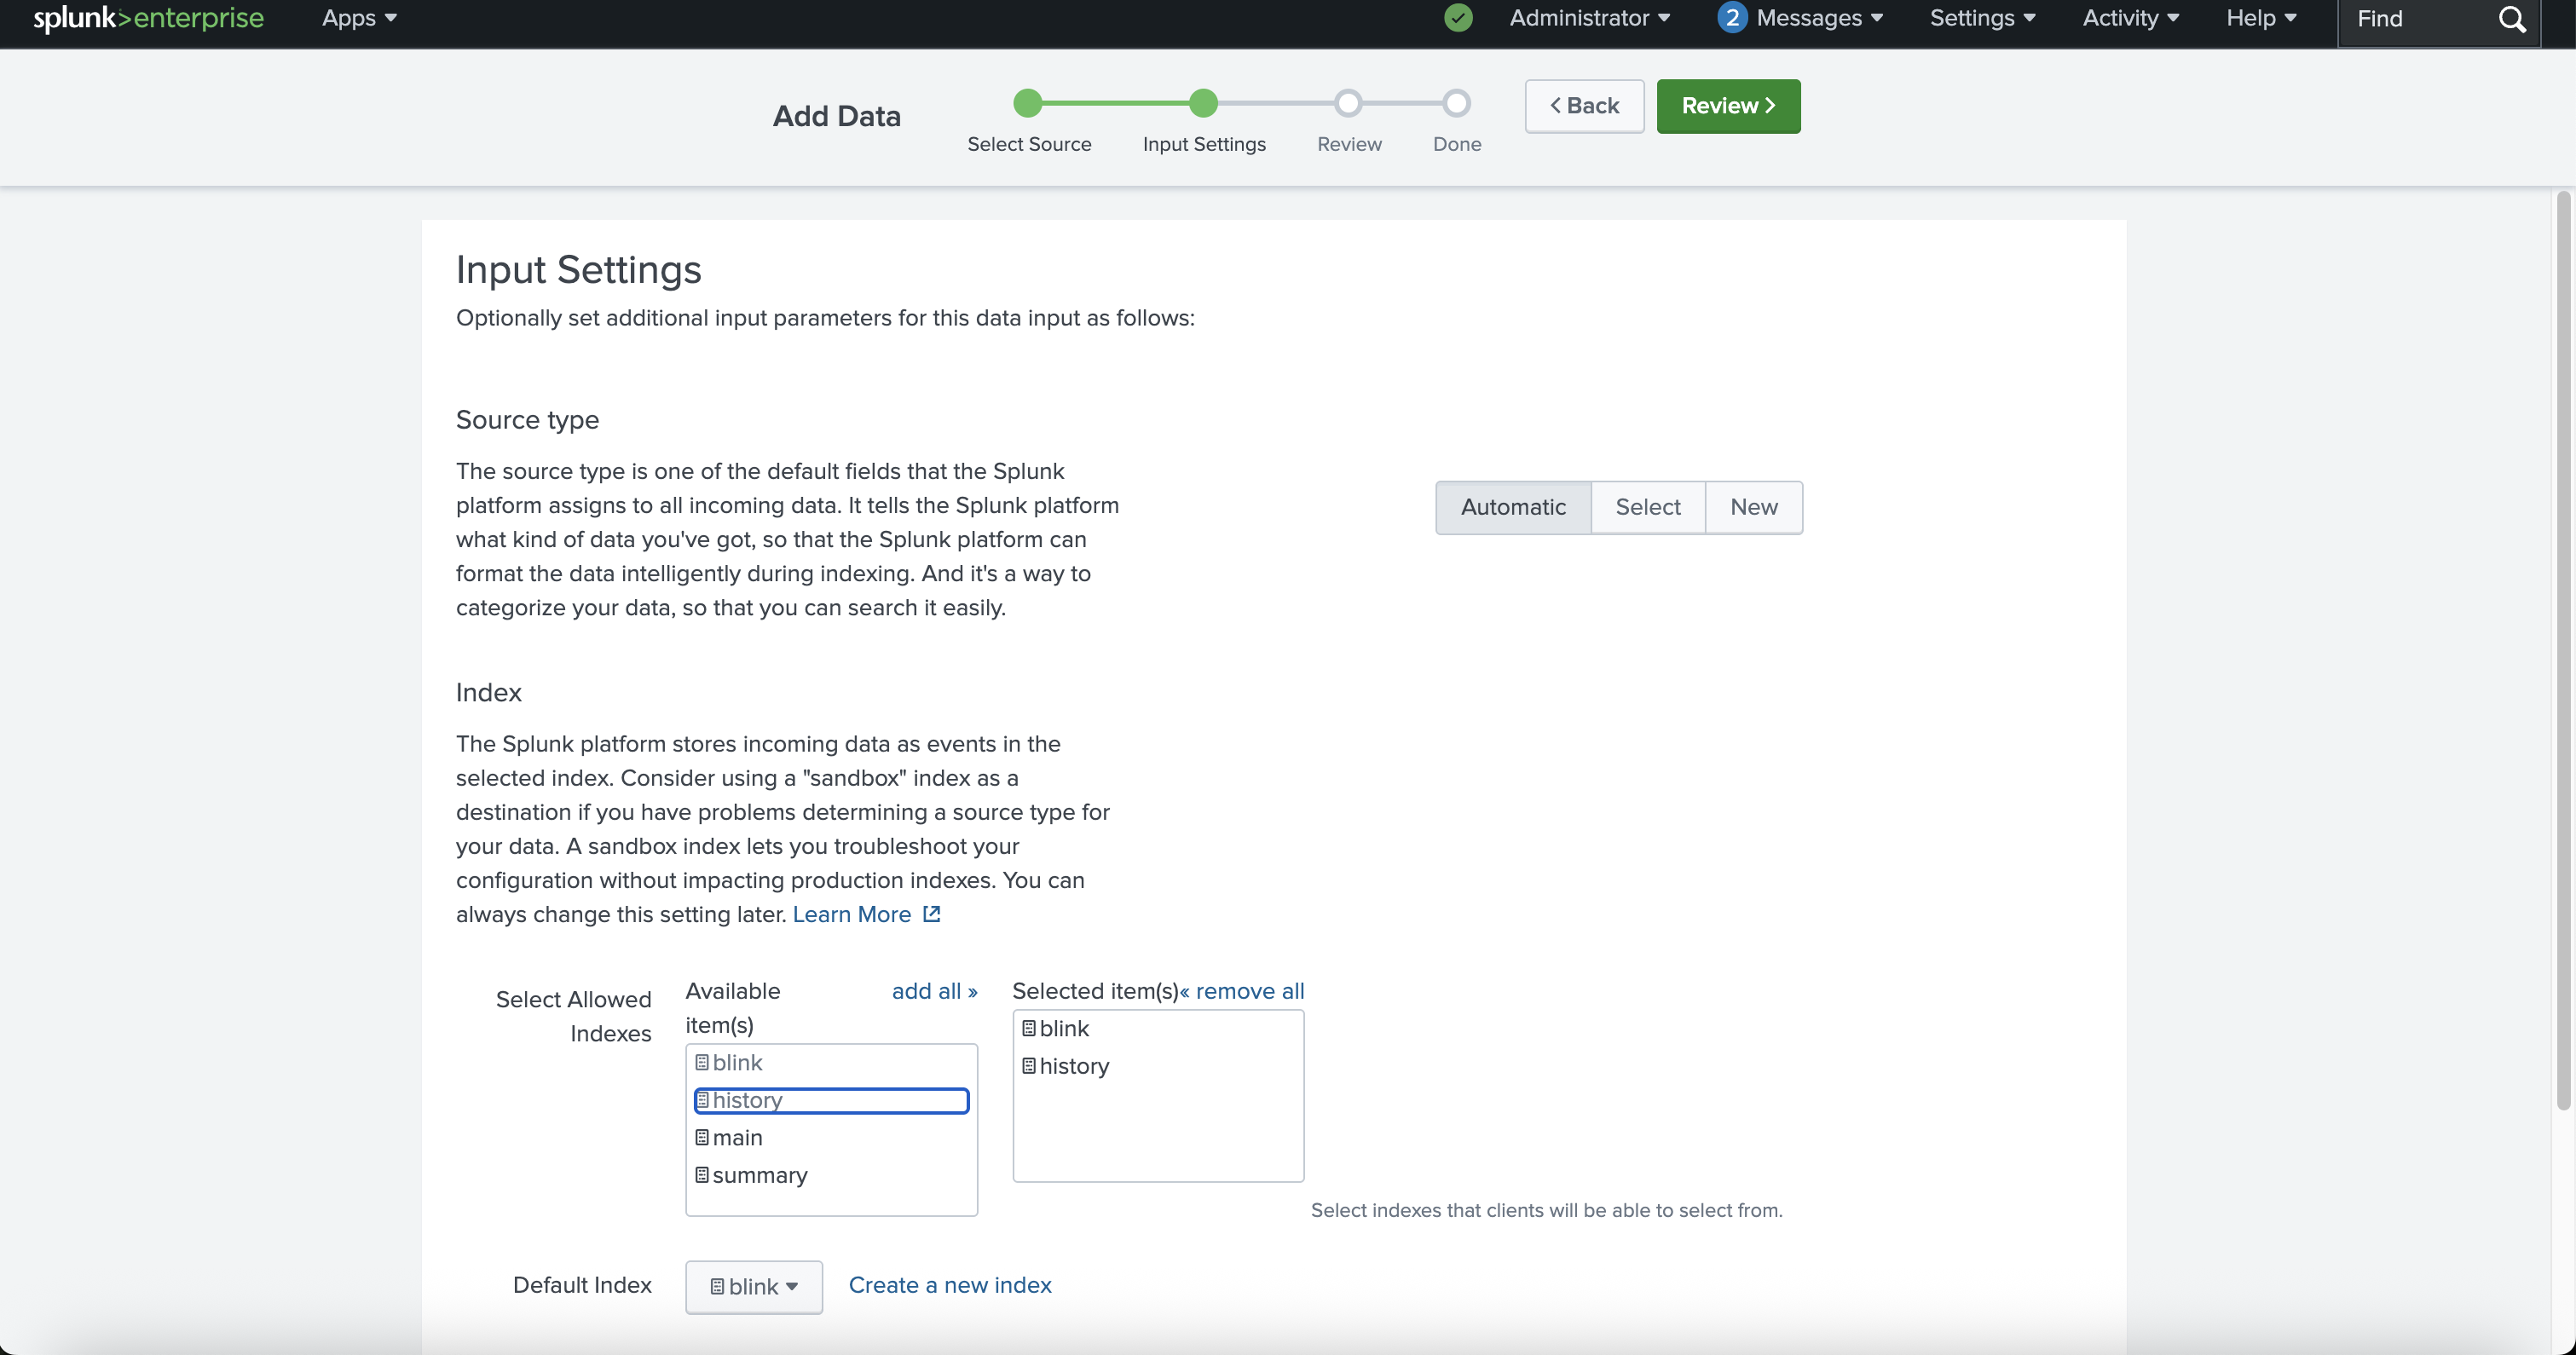
4
Review
Review all the details you have entered to ensure everything is accurate before proceeding.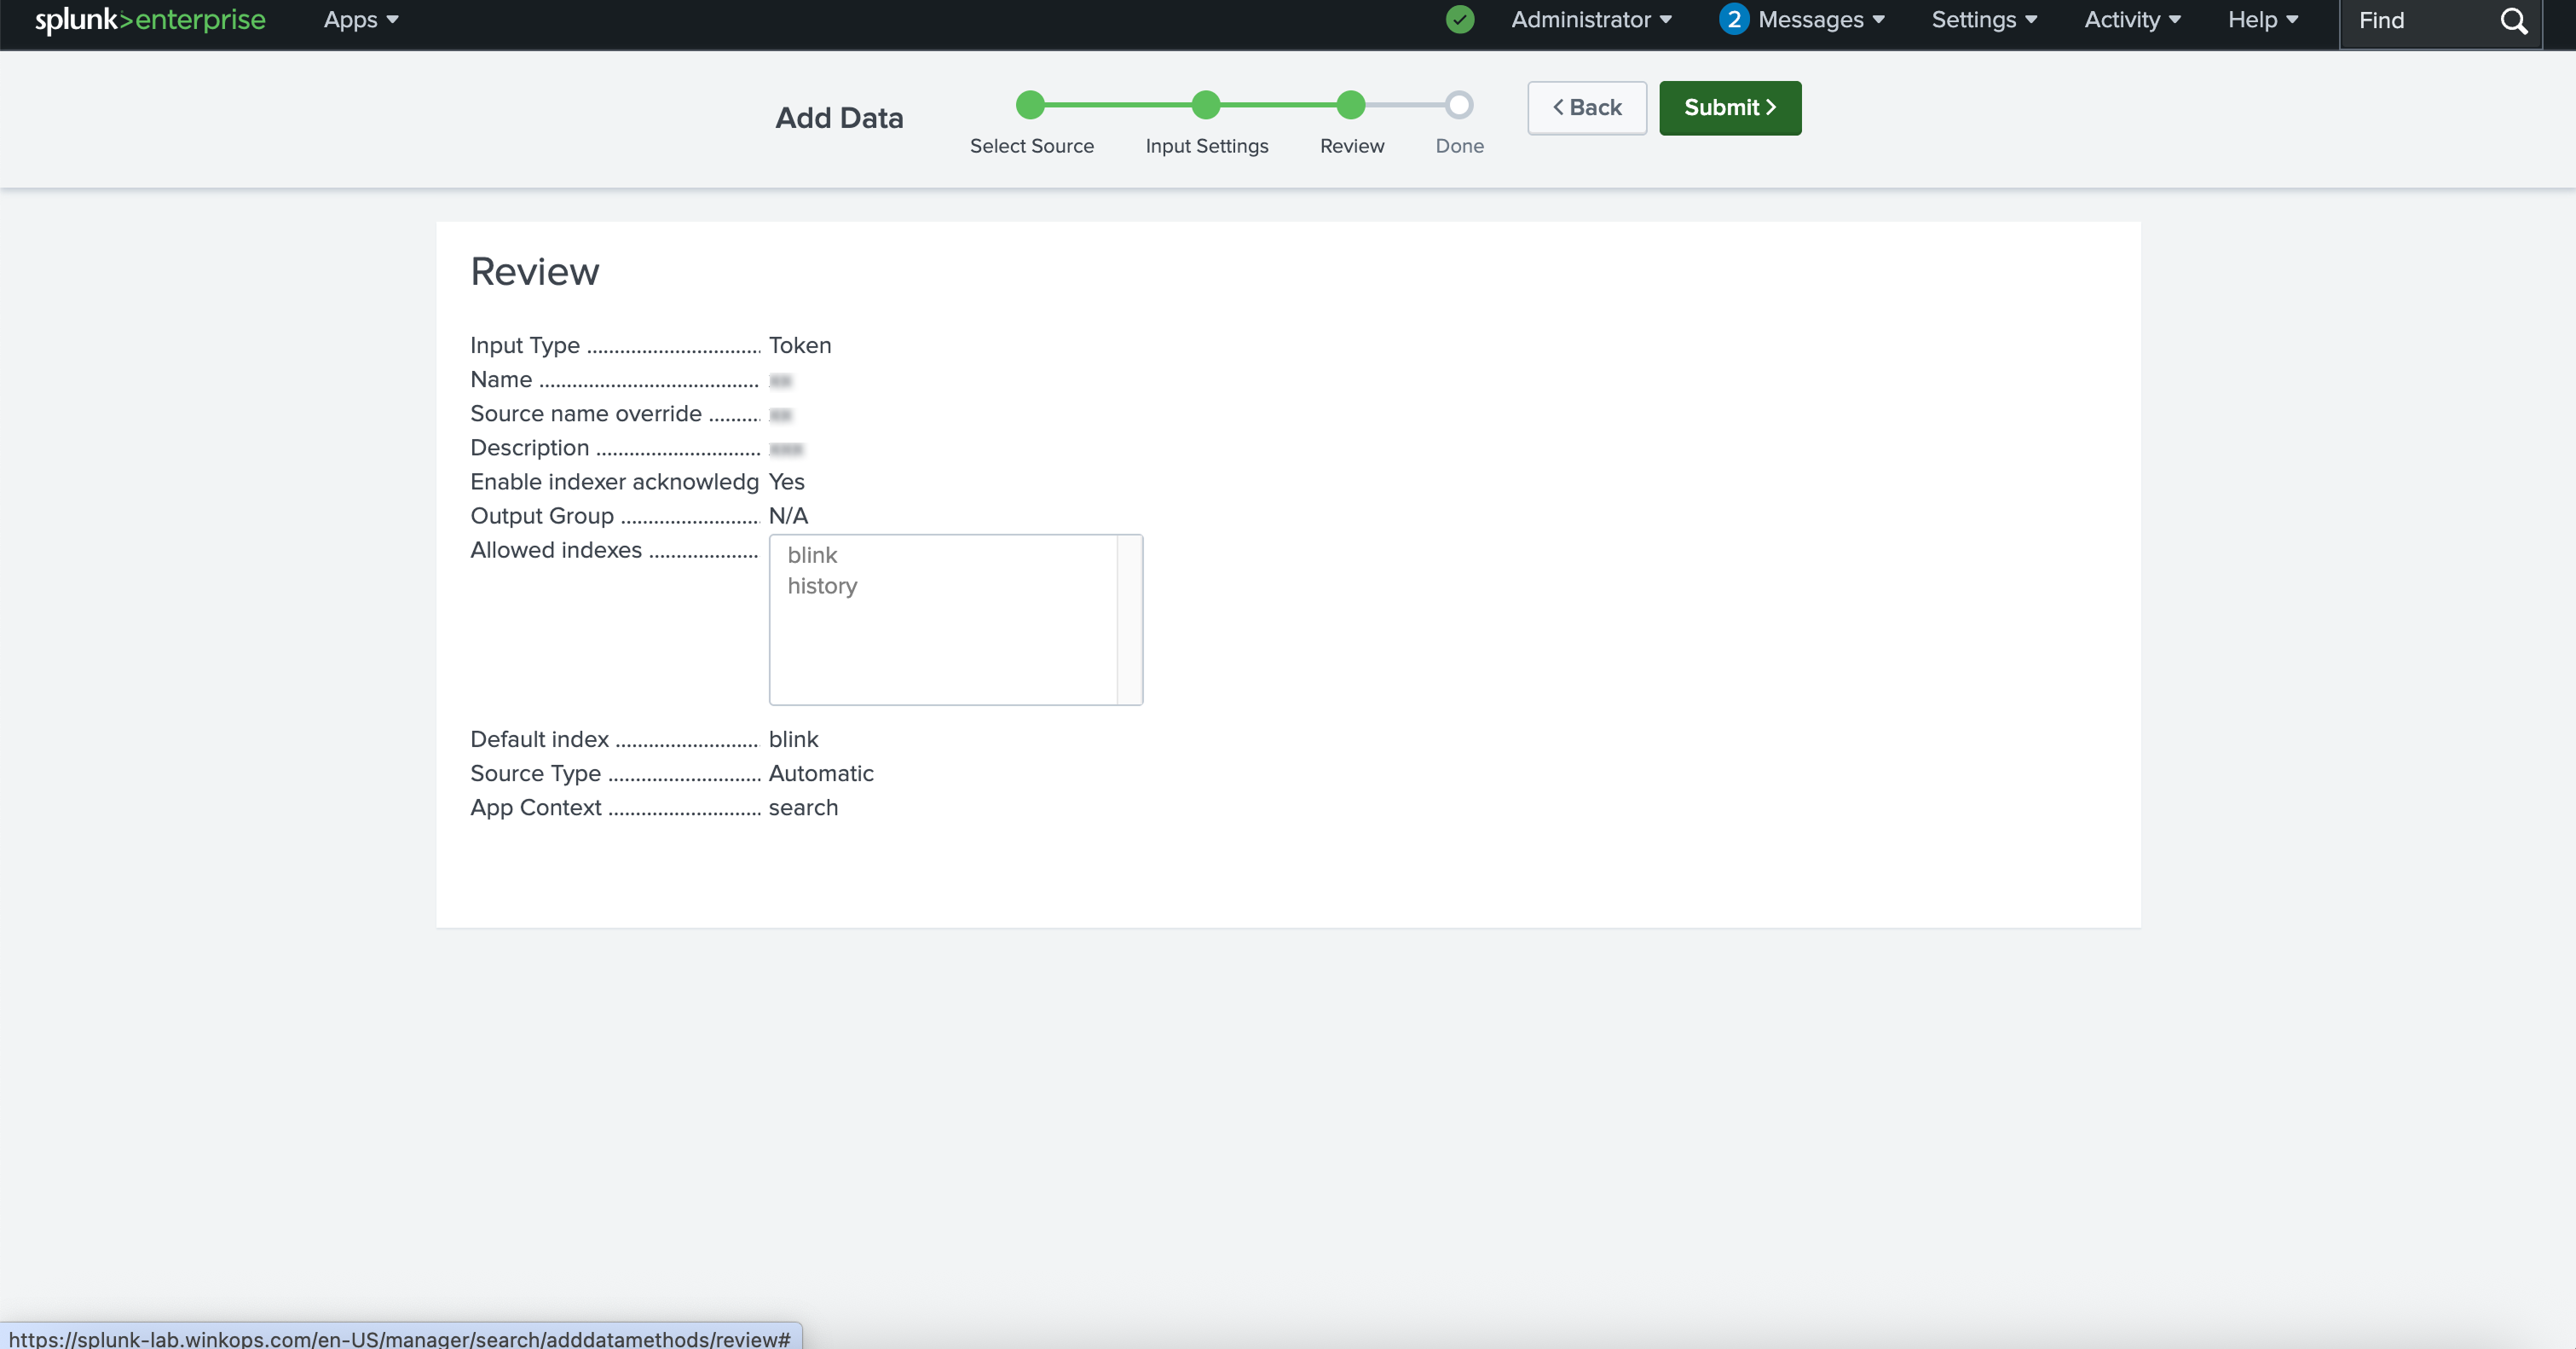
5
Token Created Successfully
Once the token has been generated in Splunk, copy it and securely store it.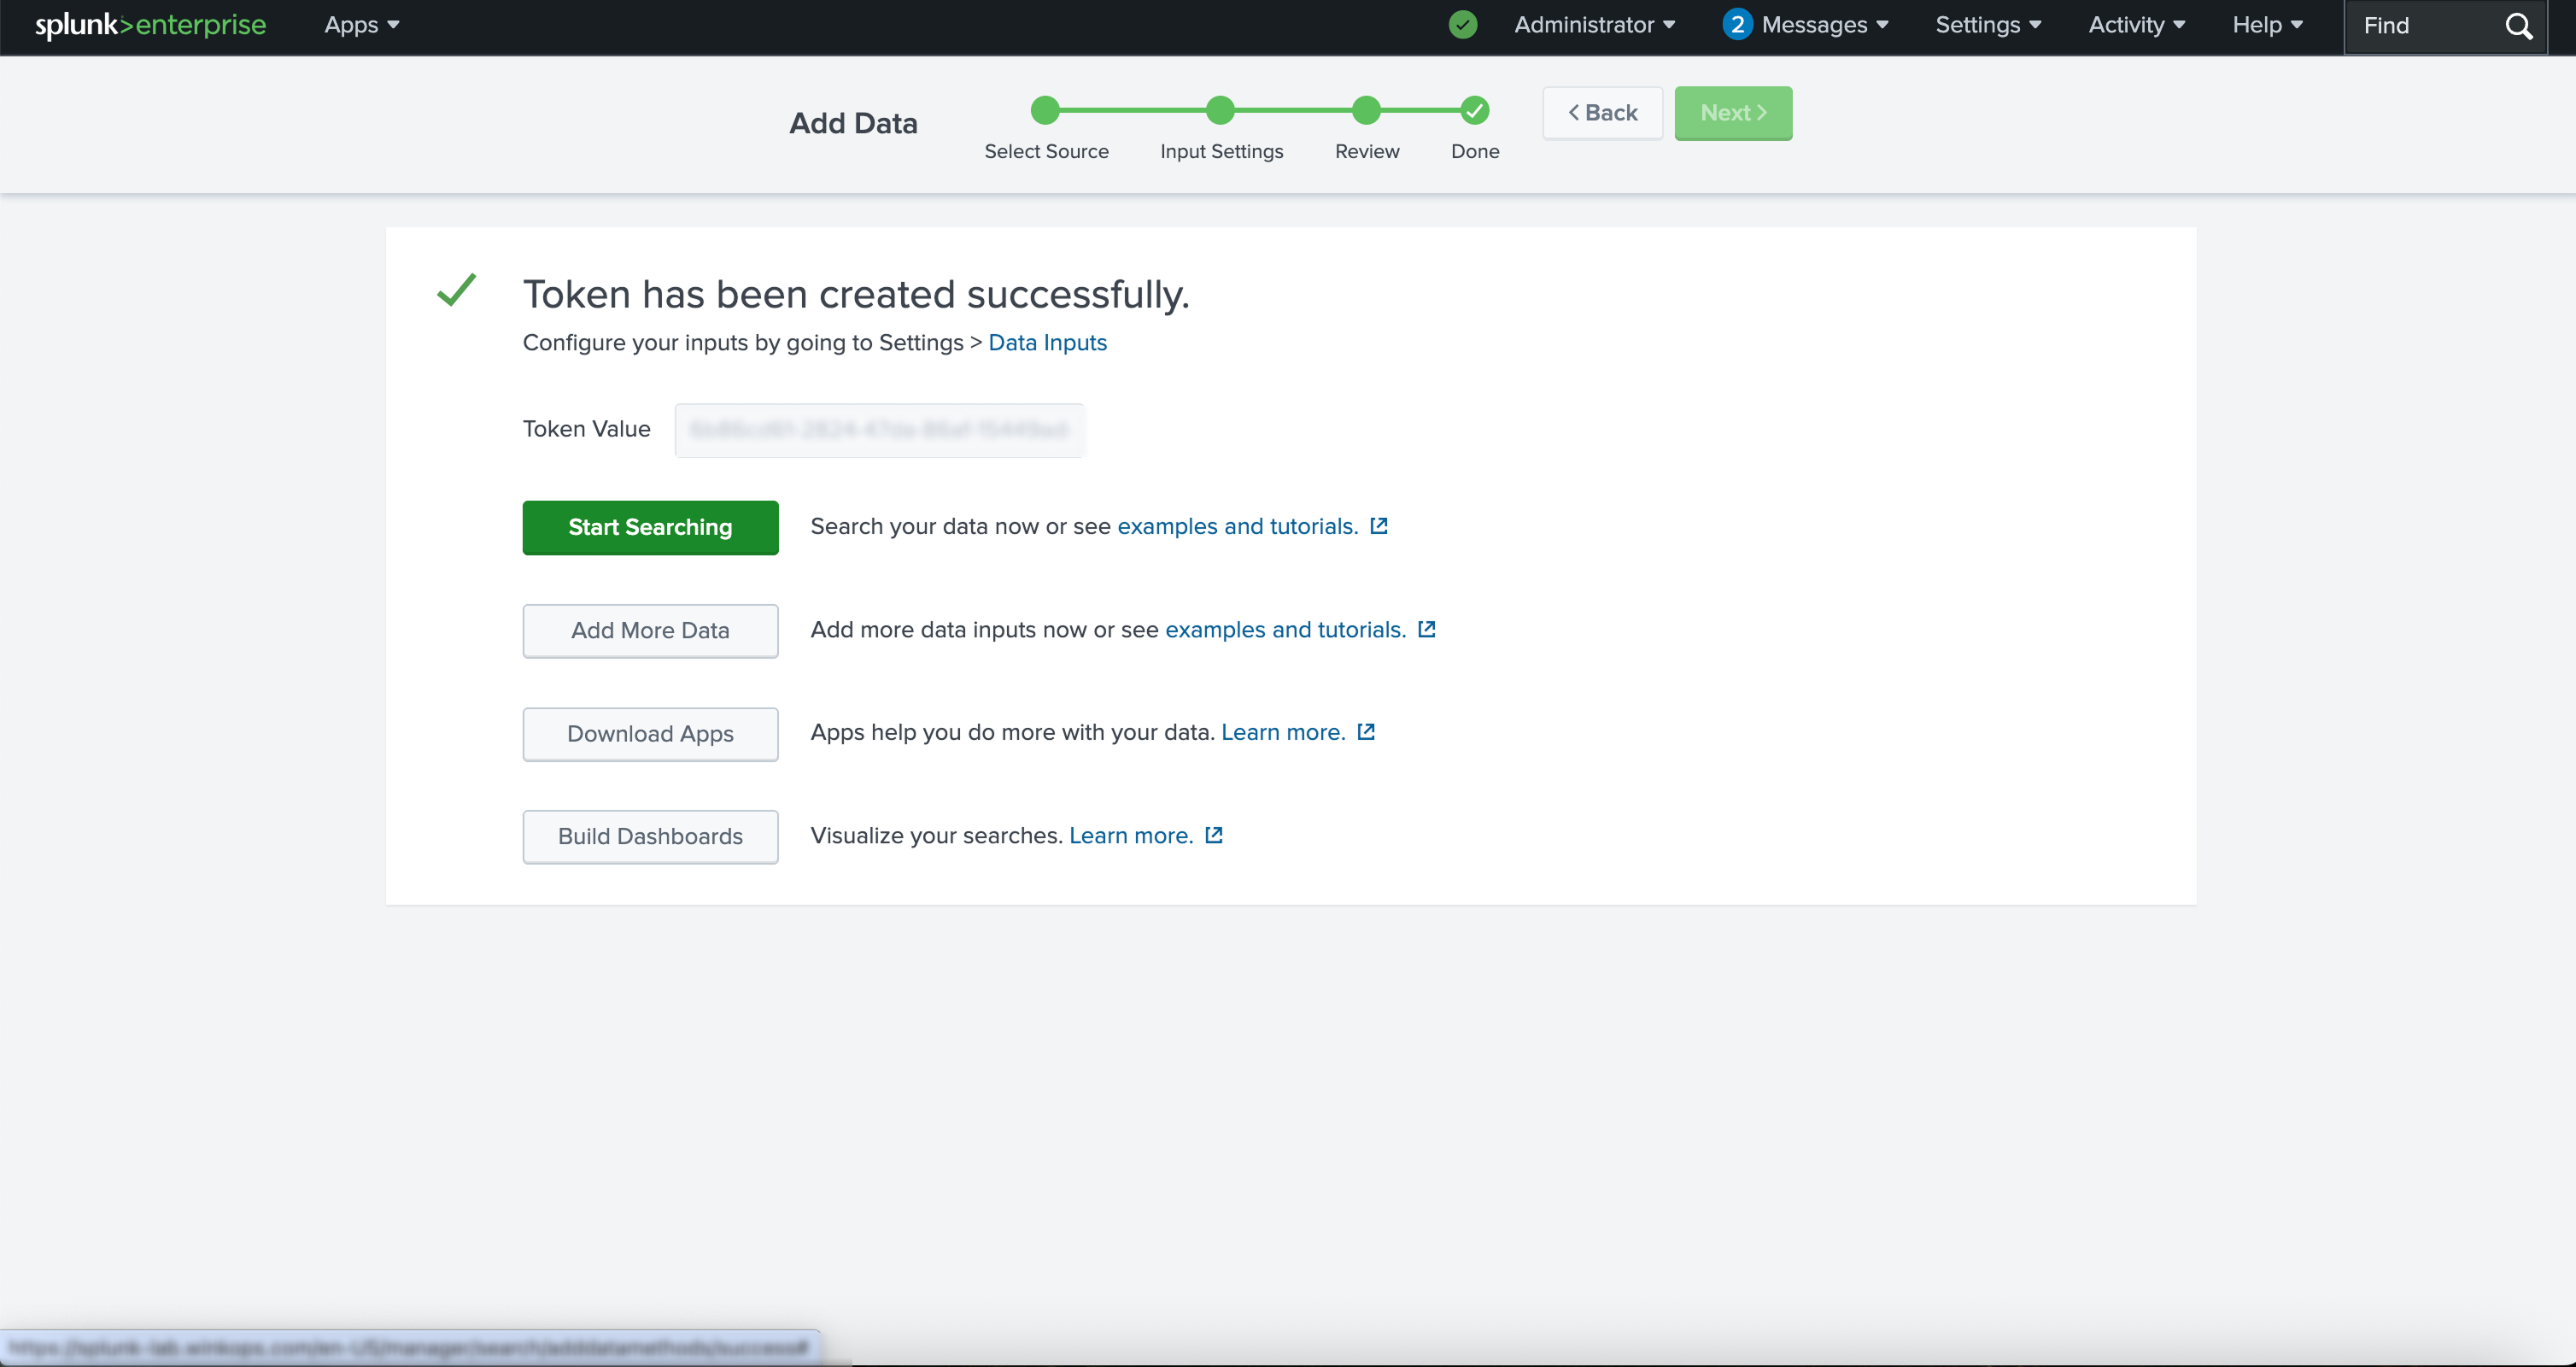
6
Integrate with Blink
To complete the integration with Blink, go to the Audit Settings section of the Blink platform and do the following:
- Paste the token into the Authentication Token field
- Enter the URL: If the HEC feature is enabled in the Splunk Enterprise platform you will see the port it uses (by default, it’s
8088). Your full url will look something like thishttps://splunk.yourcompany.com:8088 - Select Splunk HEC as the Destination Type
7
Test Connection and Save Settings
Click Test Connection to verify that the URL and token have been entered correctly and that Blink can successfully communicate with your Splunk instance. Once the connection is validated, click Save Settings to apply the configuration.