Dashboard Table Overview
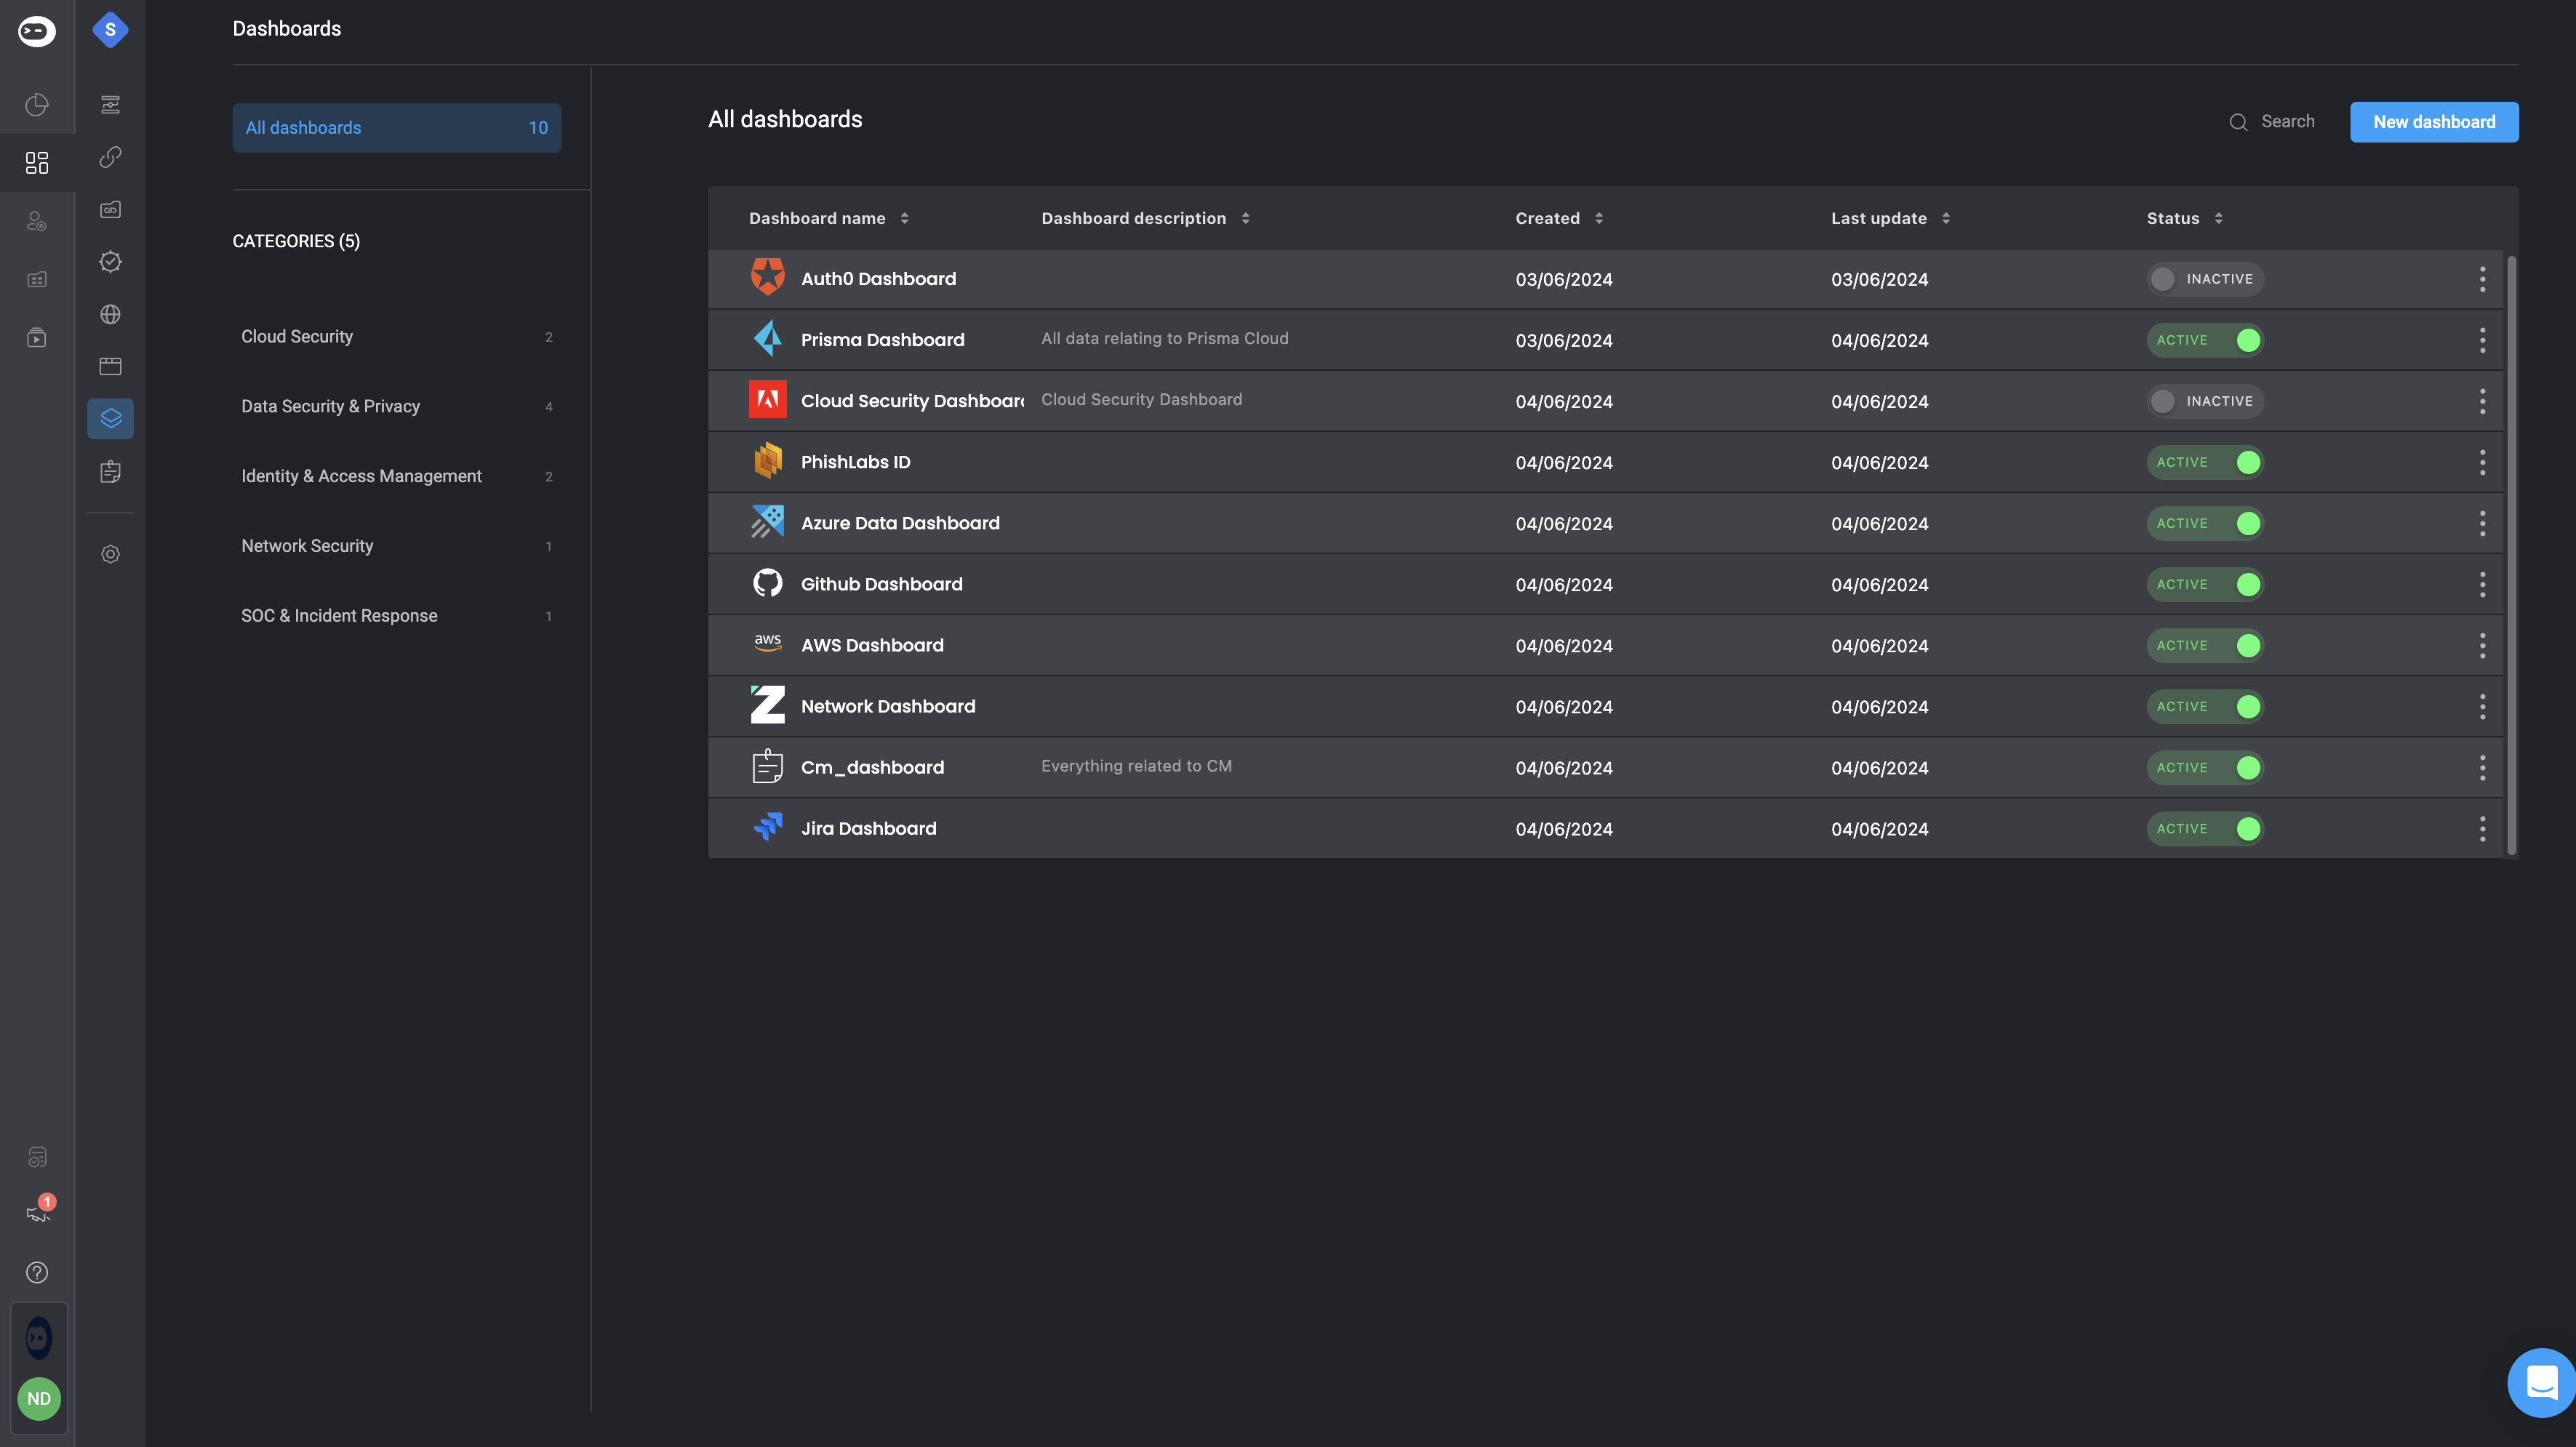
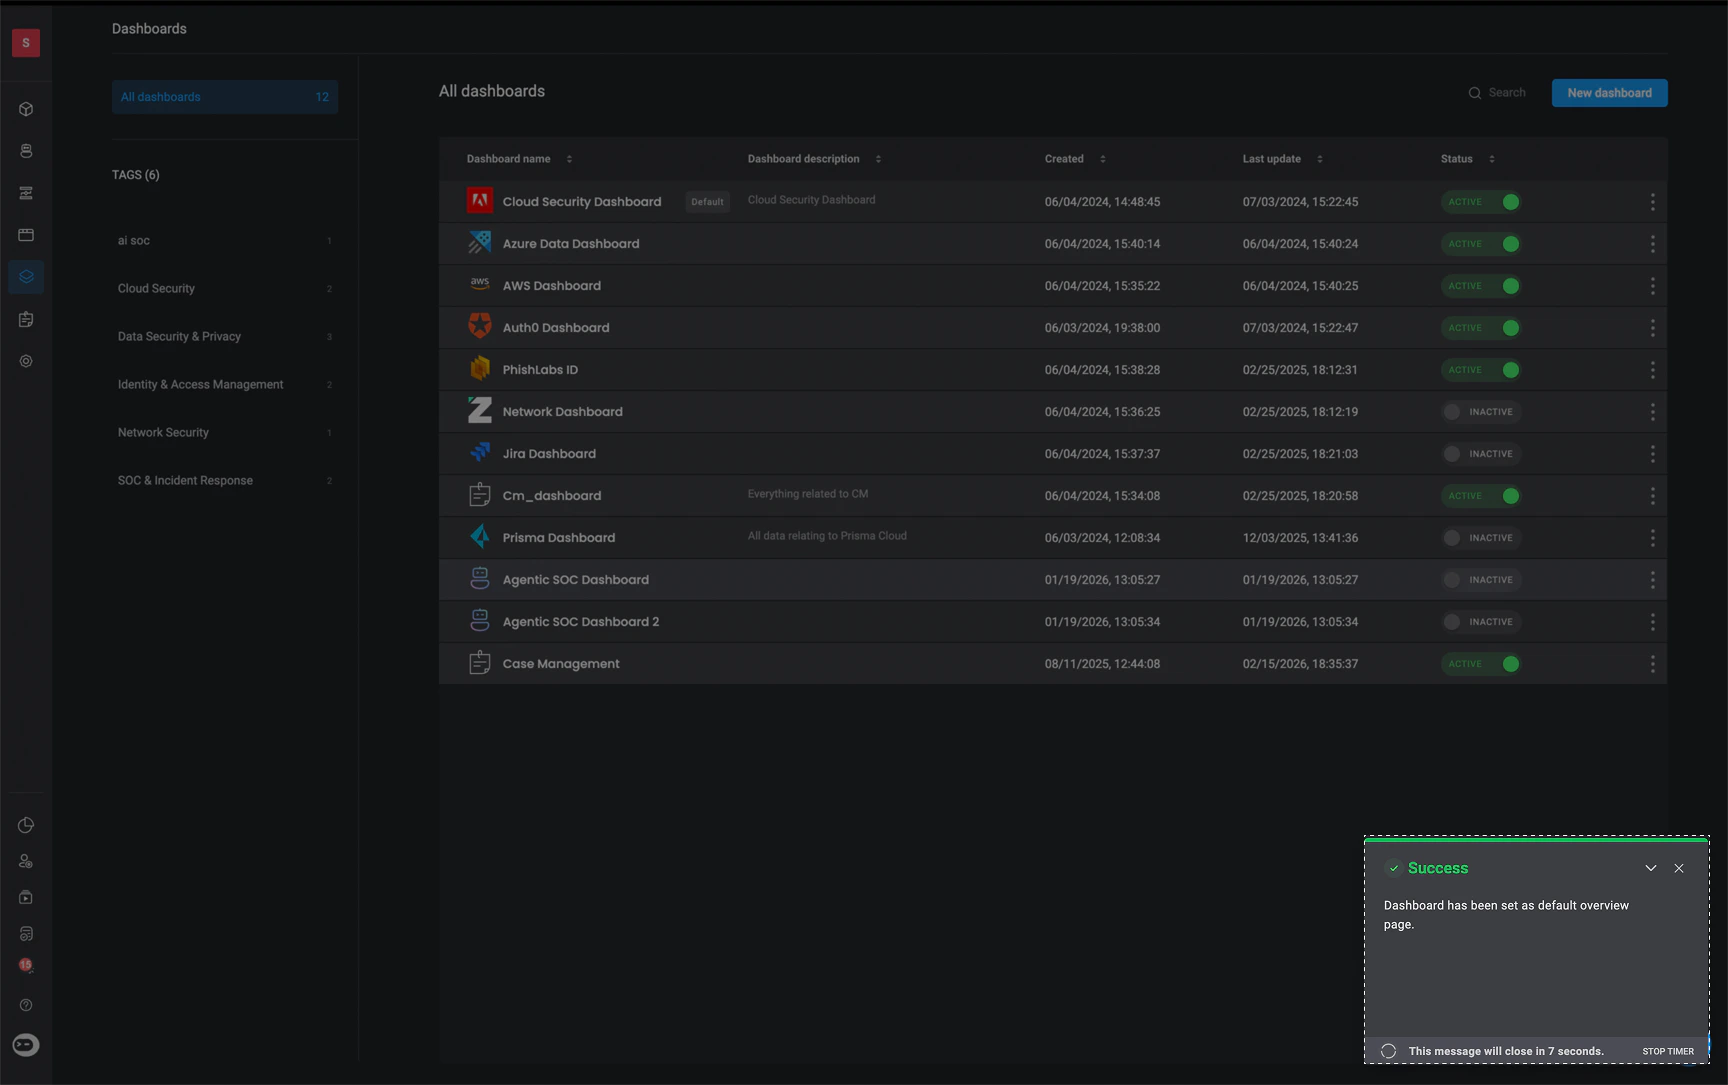
The Dashboard Table provides a complete overview of all dashboards you have created, including key details such as their status, creation date, and description. On the left-hand side, dashboards are organized into categories to help you quickly navigate and filter results when searching for a specific dashboard. The table includes the following fields:| Table Field | Description |
|---|---|
| Dashboard Name | The name of the dashboard. |
| Dashboard Description | A short description explaining the dashboard’s purpose. |
| Created At | The date the dashboard was created. |
| Last Updated | The date the dashboard was last modified. |
| Status | Indicates whether the dashboard is Active or Inactive. |
Dashboard Table Settings
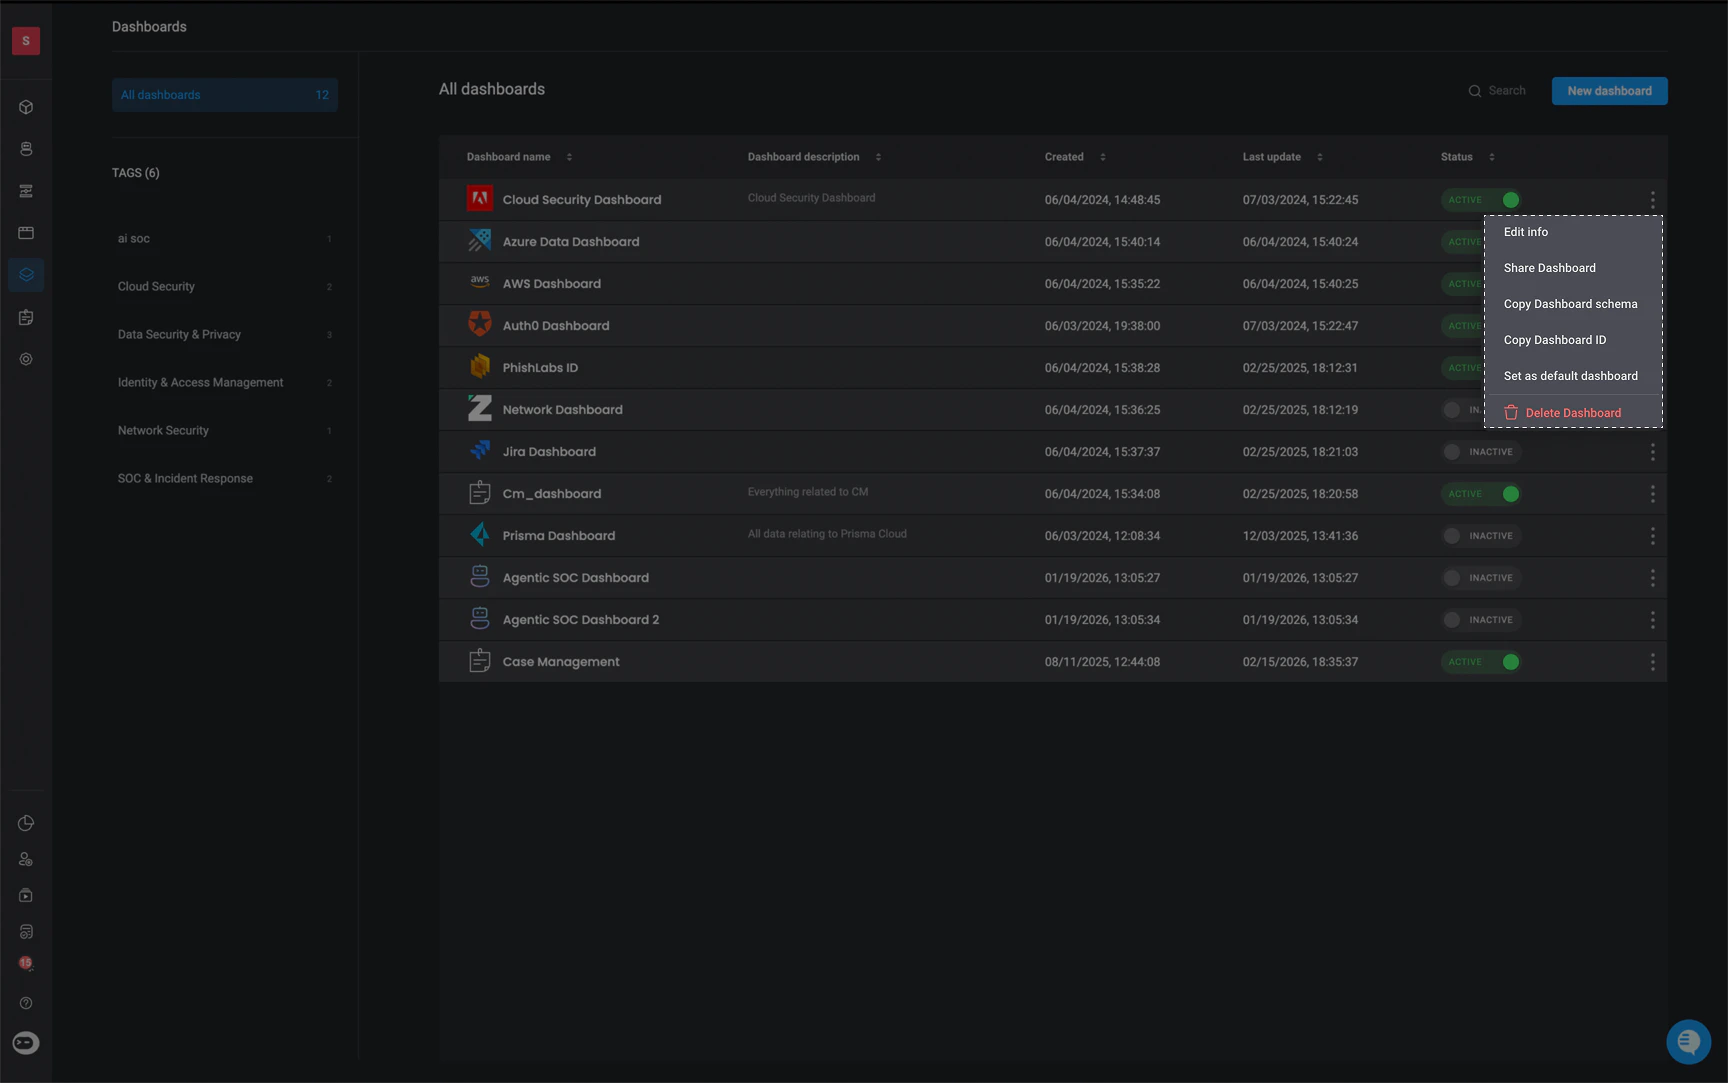
In the top-right corner of the Dashboard Table click the icon to open a menu with the following settings:
-
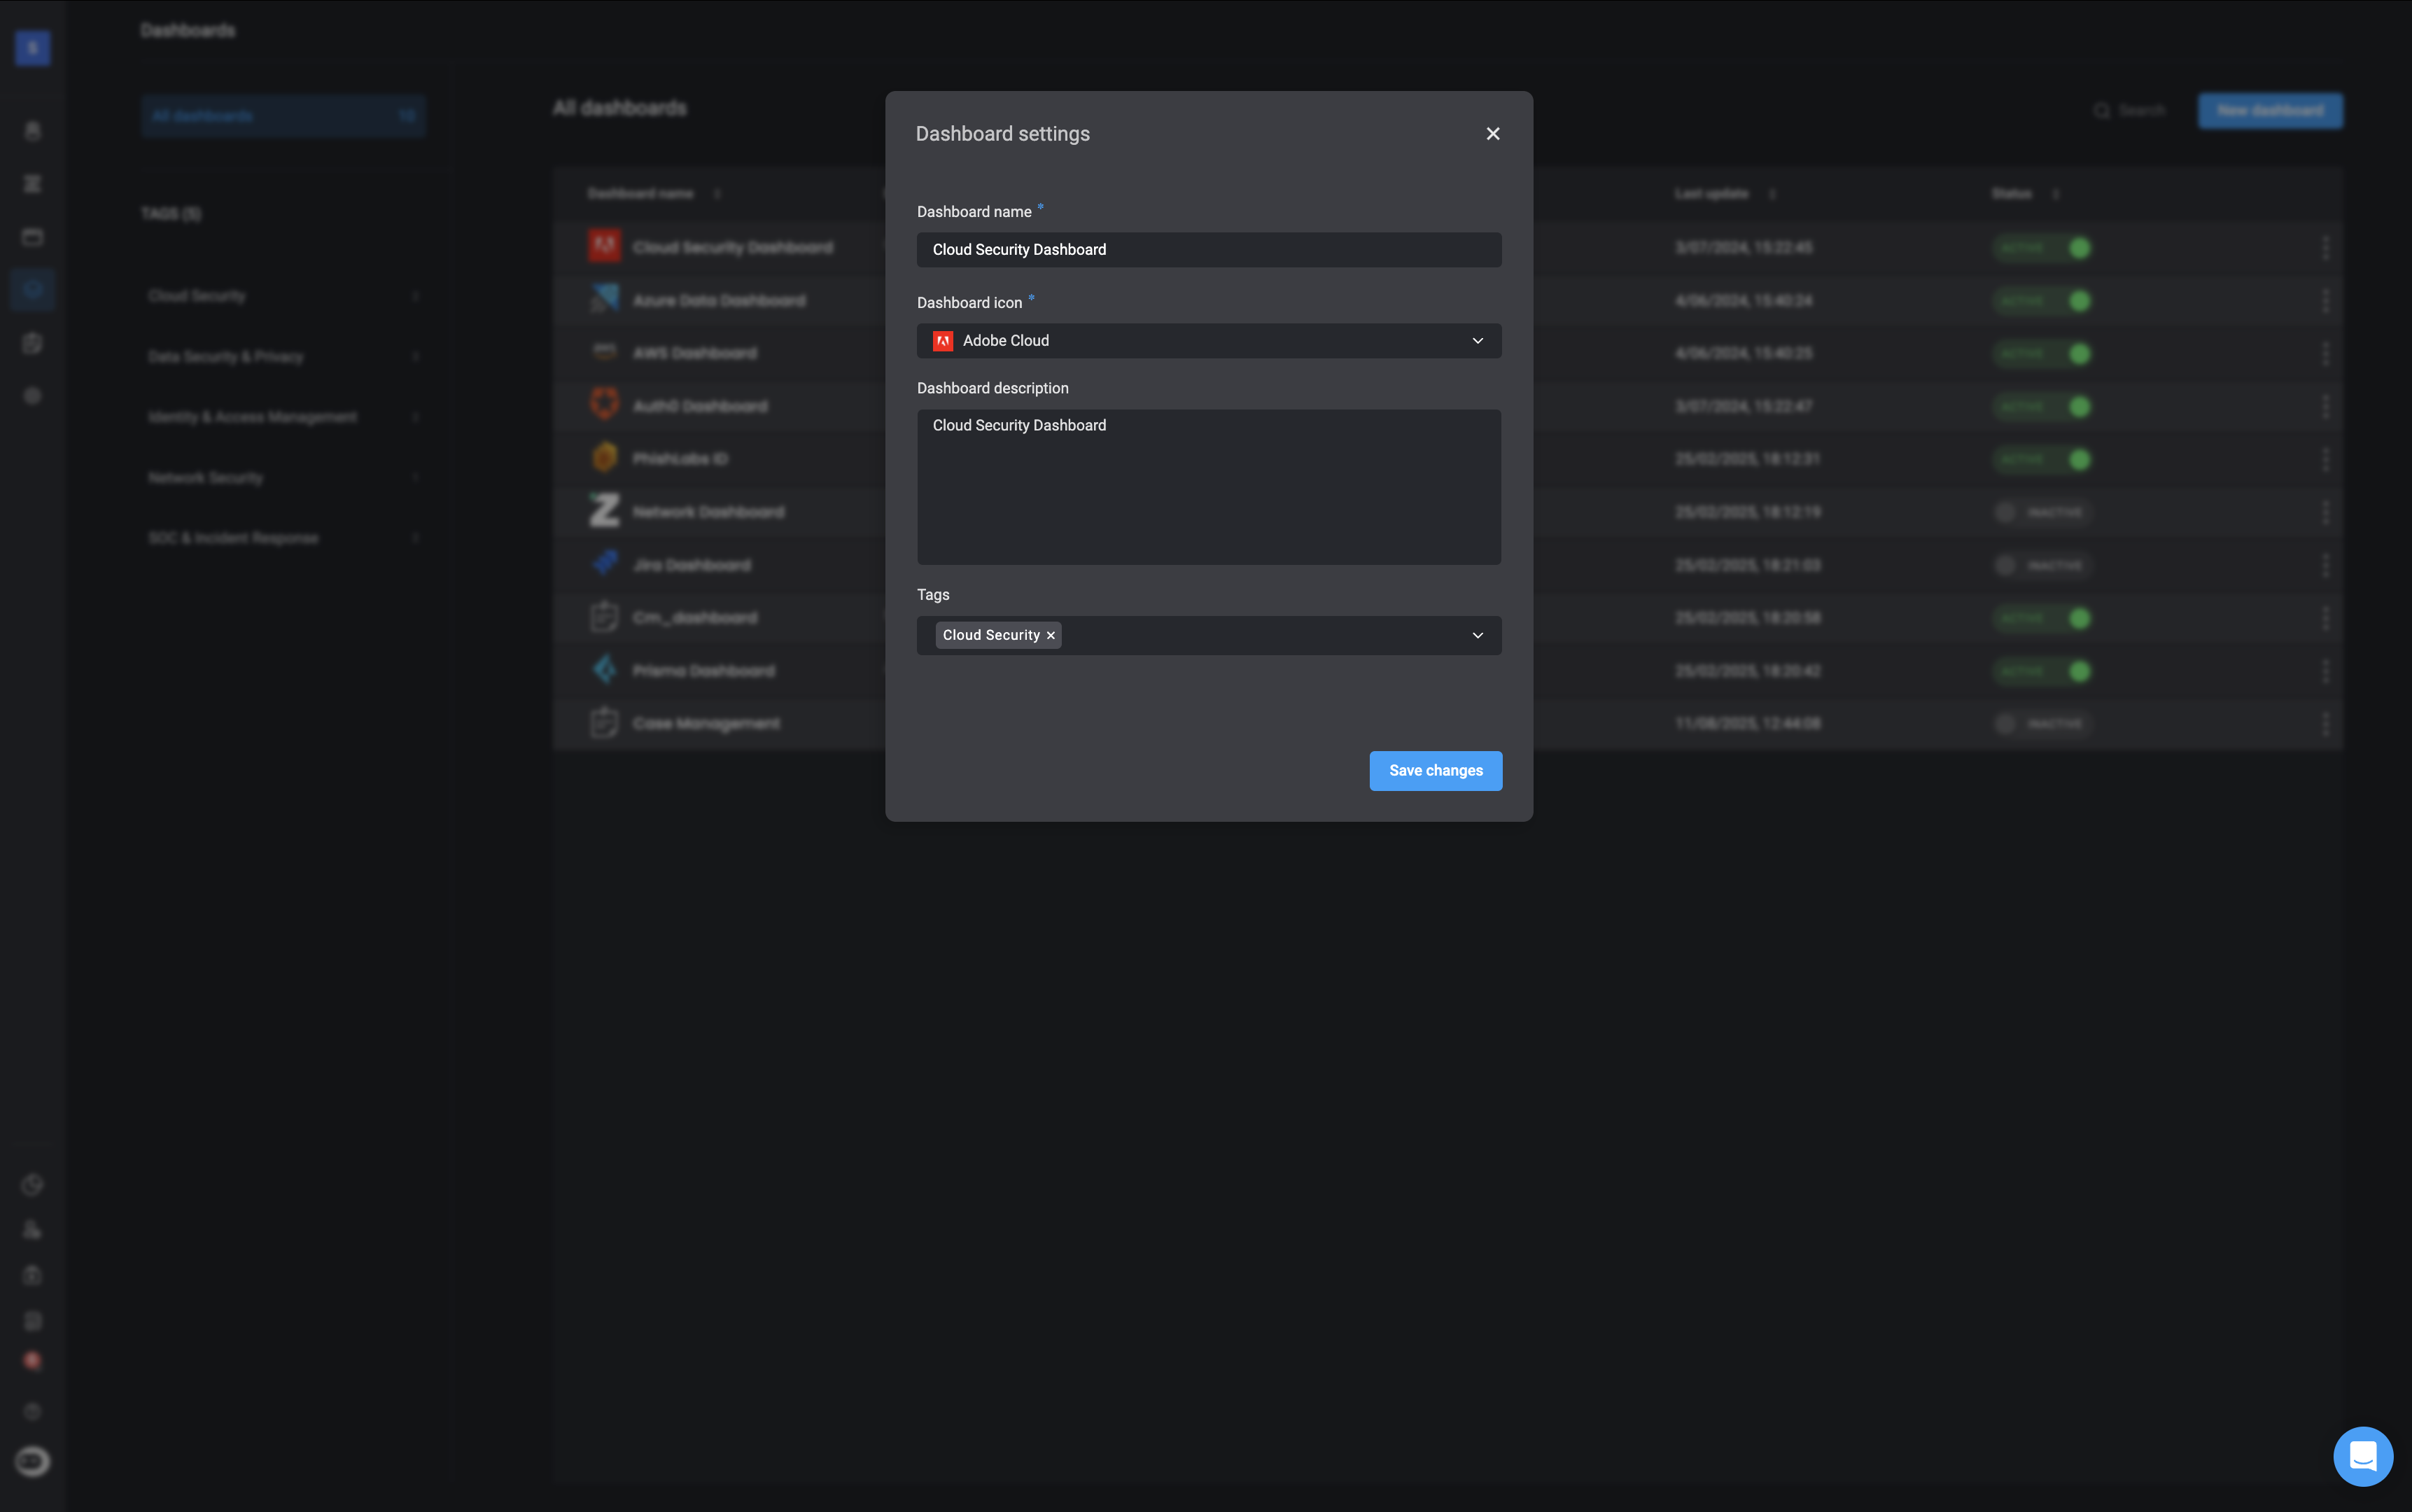
Edit Info: Update your dashboard’s information as needed. After making changes, click Save Changes to apply them automatically.
-
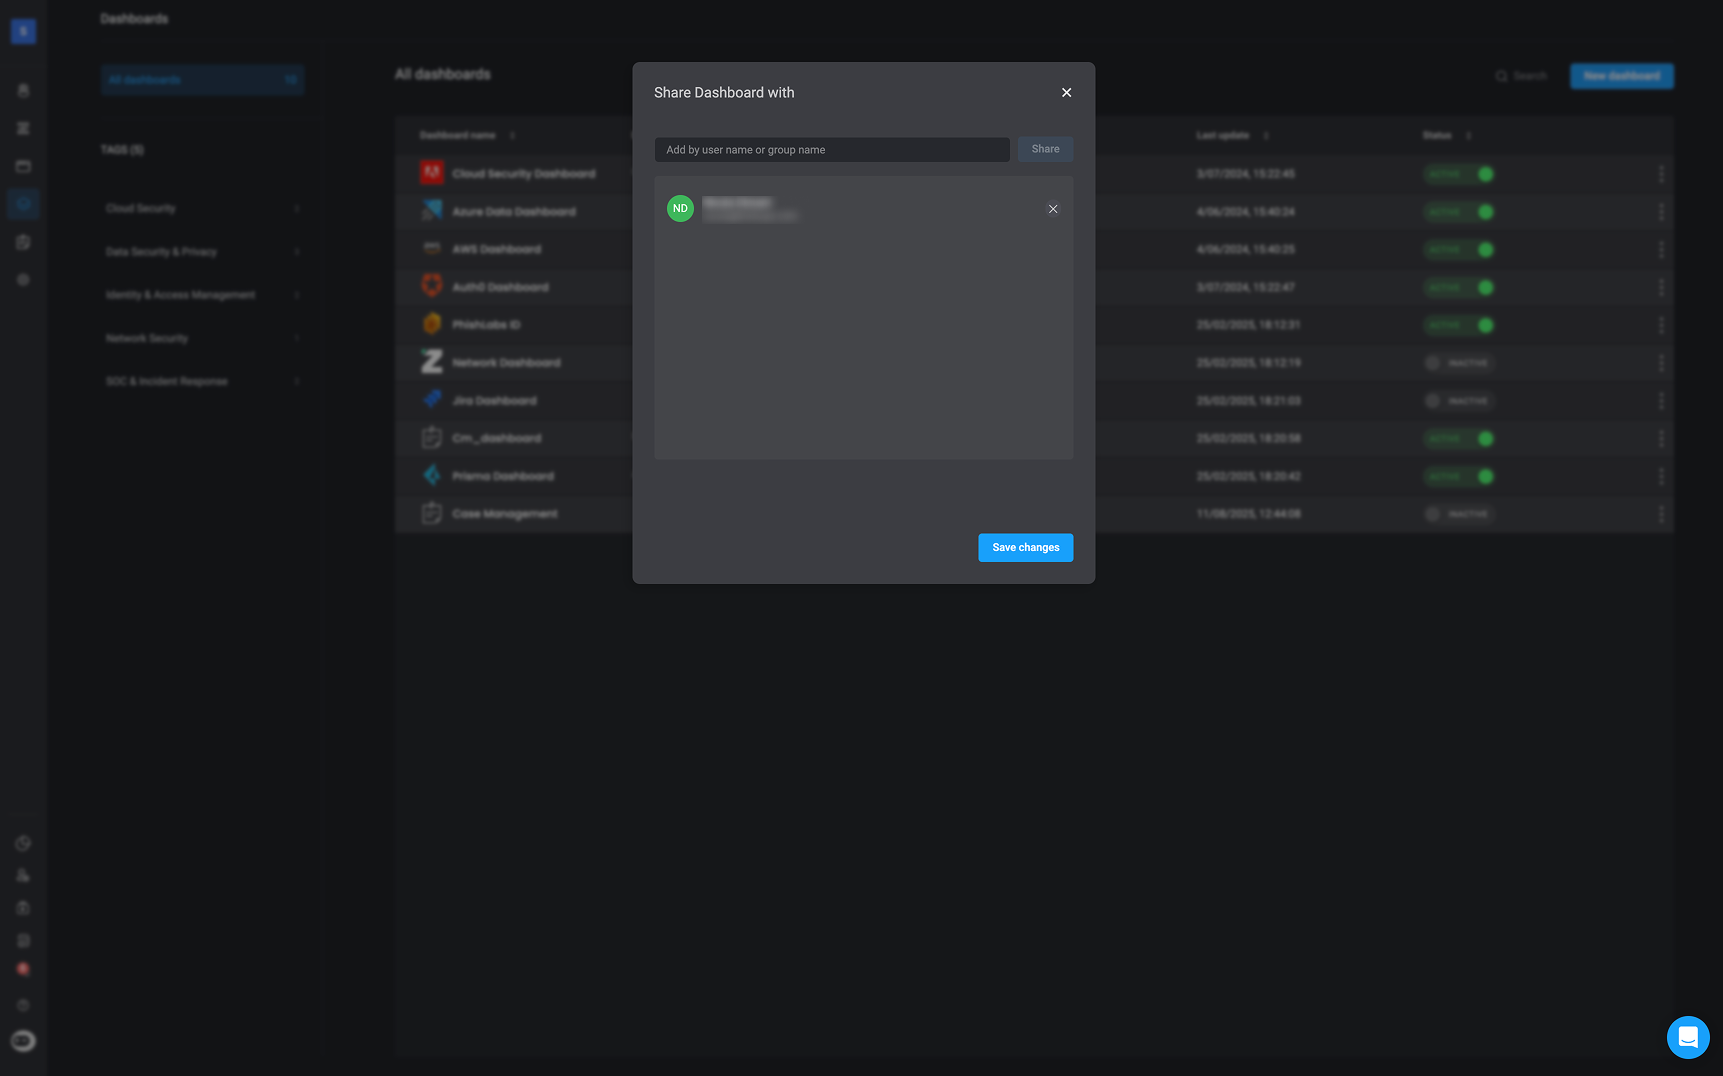
Share Dashboard: - You can share an activated dashboard by entering the the name of the user or group you want to share the selected dashboard with.
Note: You cannot share a disabled dashboard.
-
Copy Dashboard Schema- Copies the JSON syntax of the selected Dashboard
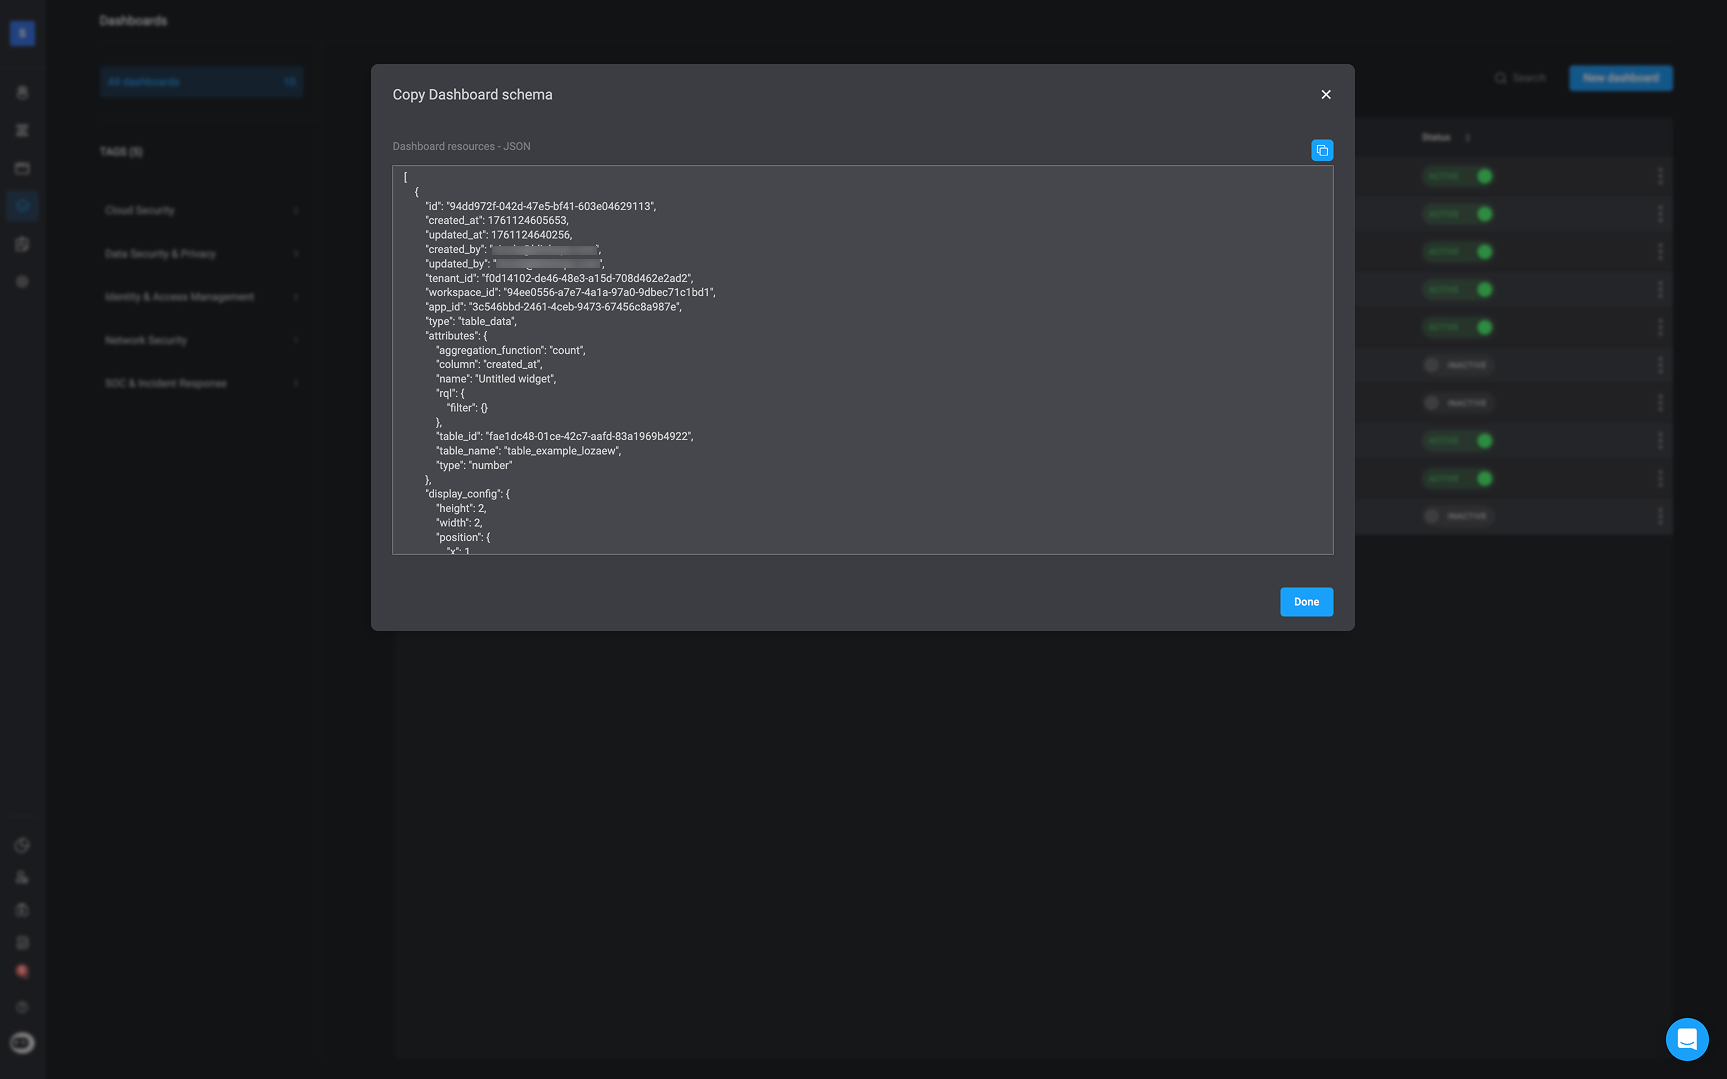
- Copy Dashboard ID- Copies the selected Dashboard’s unique ID
-
Set as Default – Marking a dashboard as default ensures it automatically appears as the primary dashboard on your Overview page.
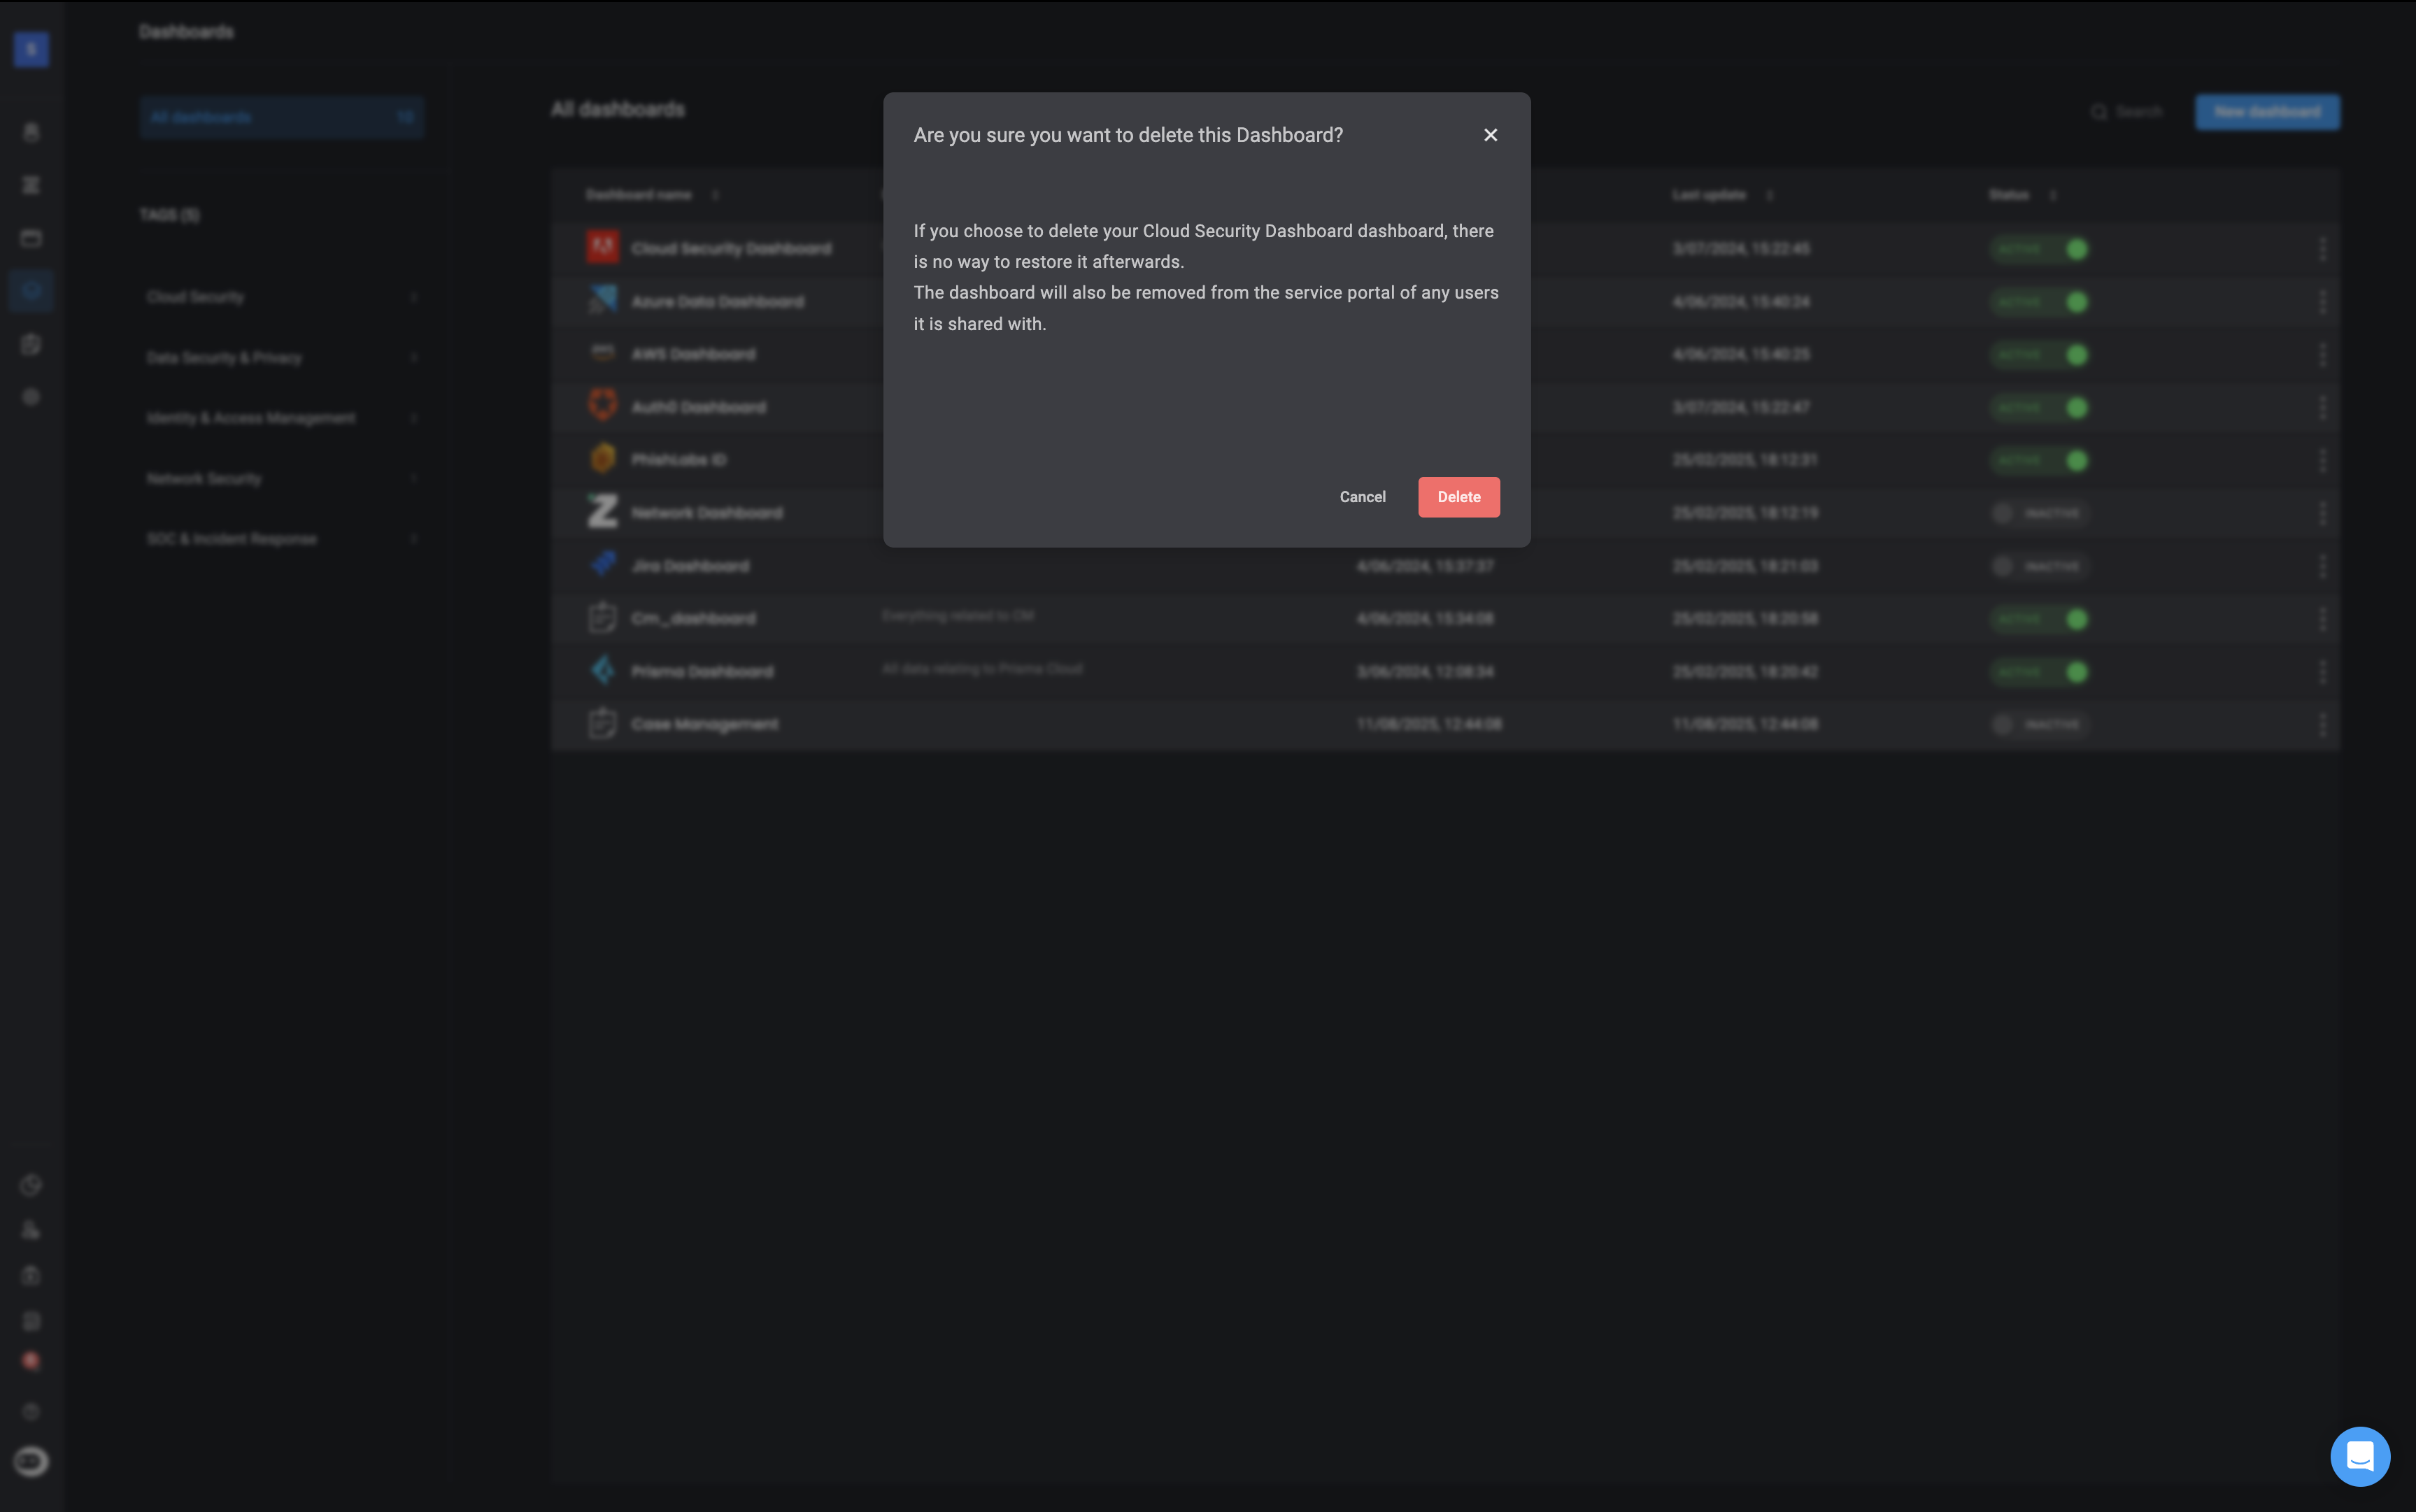
-
Delete: Permanently removes the selected dashboard and all it’s content.