v9.0
Blink’s Automated Case Management Process streamlines how security teams ingest, enrich, investigate, and respond to alerts from multiple monitoring tools and 3rd-party sources By automating these tasks end-to-end, it enables faster and more consistent triage of potential threats.
The purpose of Blink’s Automated Case Management Process is to reduce manual overhead, maintain data consistency, and accelerate incident response by connecting alert data with contextual information, enrichment tools, and response actions.
This documentation provides a breakdown of each phase in the automated case management pipeline, including data transformations, enrichment logic, response strategies and use case examples.
Key Stages
The process is composed of four key stages and is designed to streamline the entire incident handling from alert ingestion to case remediation| Stage | Description |
|---|---|
| Alert Ingestion | In the Alert Ingestion process, alerts are harvested from external systems, such as SIEMs (Security Information and Event Management) or other monitoring tools, in real time. This process collects raw alert data as soon as it is generated by the vendor. The primary action in this stage is to open an alert record, which stores the received payload for further processing. This is the starting point of the workflow where data enters the system. |
| Alert Processing | The Alert Processing phase extracts key observables from raw alert data using predefined templates in the Alert Templates Table. The system checks whether each alert has already been processed and flags unprocessed alerts for further attention, ensuring efficient and accurate data handling. |
| Enrichments | The Enrichment process is designed to enrich and maintain the enrichment of observables. This phase is fully customizable for each customer, allowing adjustments based on their specific toolset and preferred enrichment methods. It consists of vendor-specific subflows, which can be selected or tailored per client. |
| Response | The Response process is designed to automate the response process for cases. This phase can be fully customized to suit each customer’s specific tools and preferred workflows. |
Flow Diagram Showing the Case Management Automated Processes
The following flow diagram provides an in-depth explanation of how Blink handles alert and case processing, offering insights into each stage of the workflow, associated subflows, data transformations, and examples for testing.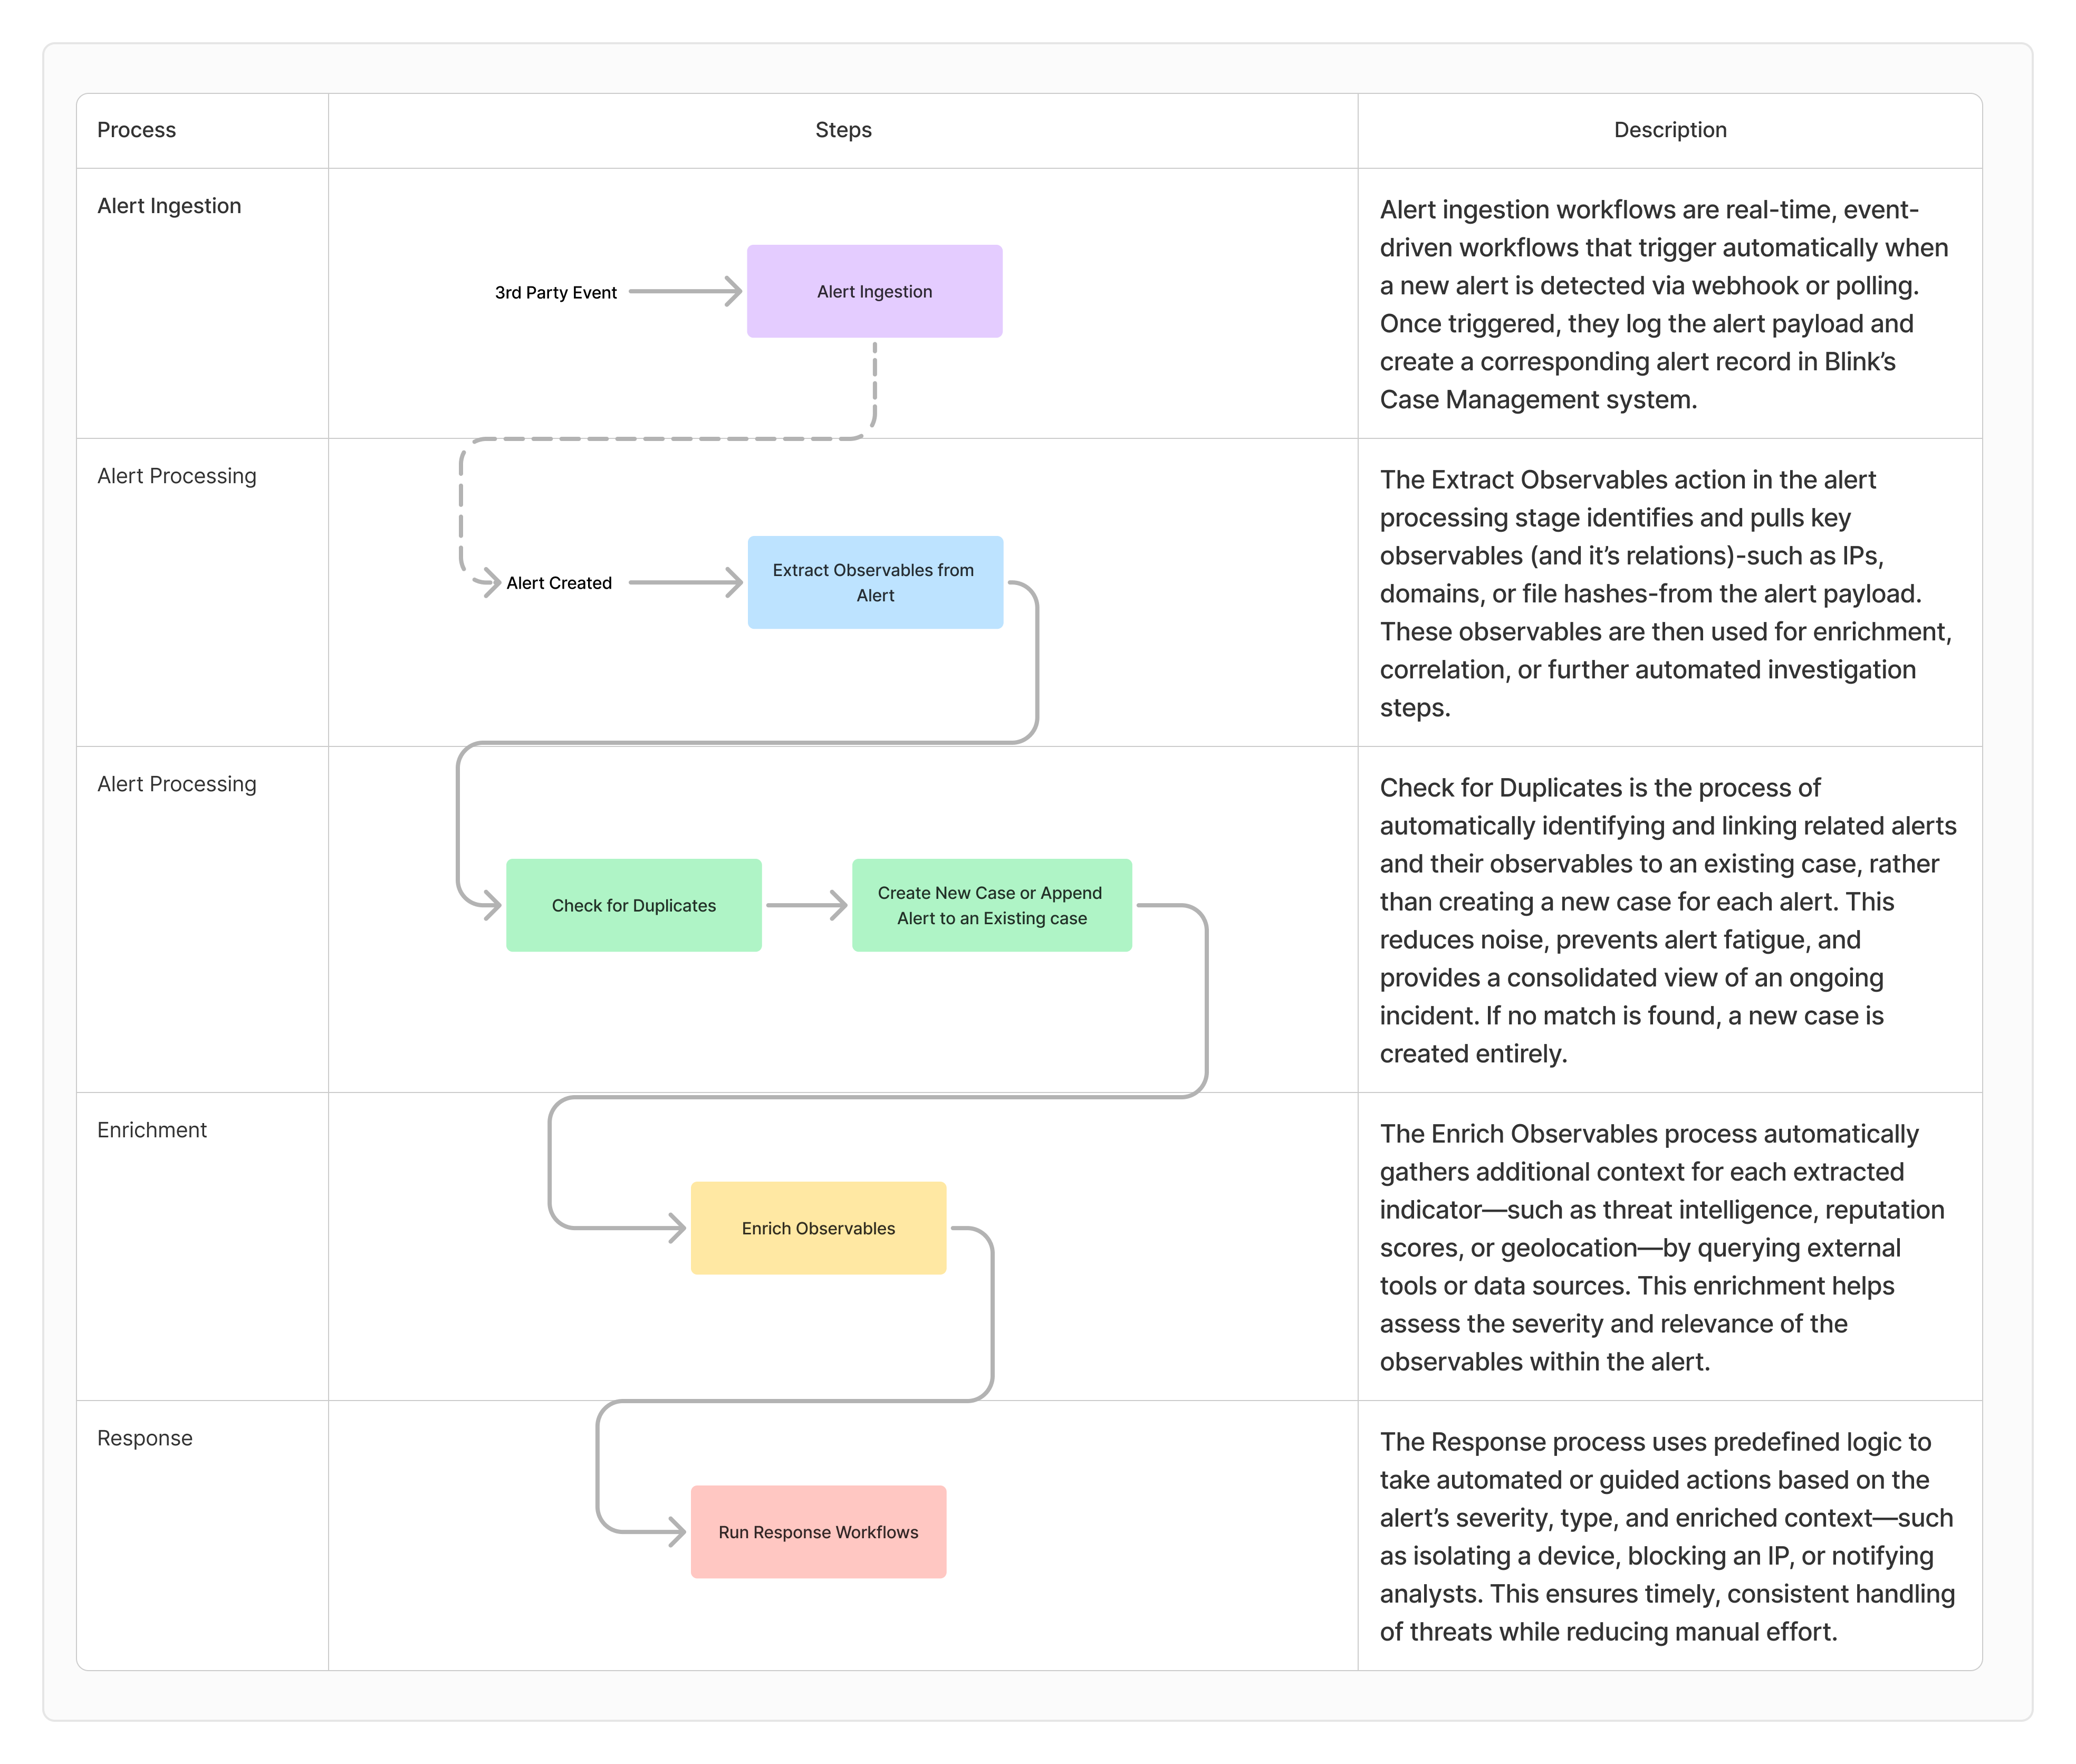
Detailed Guide of the Automated Case Management Process - Use Case Example
Blink’s Automated Case Management Process is fully customizable to support a wide range of client requirements, workflows, and tools.
/Users/wilder/whoami.rtf being executed as a command, despite its rtf extension suggesting a benign document. This behavior is characteristic of the Masquerading technique, where adversaries disguise executable files using misleading extensions.
Stage 1- Alert Ingestion
Stage 1- Alert Ingestion
Description: This workflow is triggered by a CrowdStrike Webhook Event, initiating the ‘Alert Ingestion’ process automatically upon receiving an event from CrowdStrike.
How It Works: Upon receiving a webhook event from CrowdStrike, the workflow performs the following steps: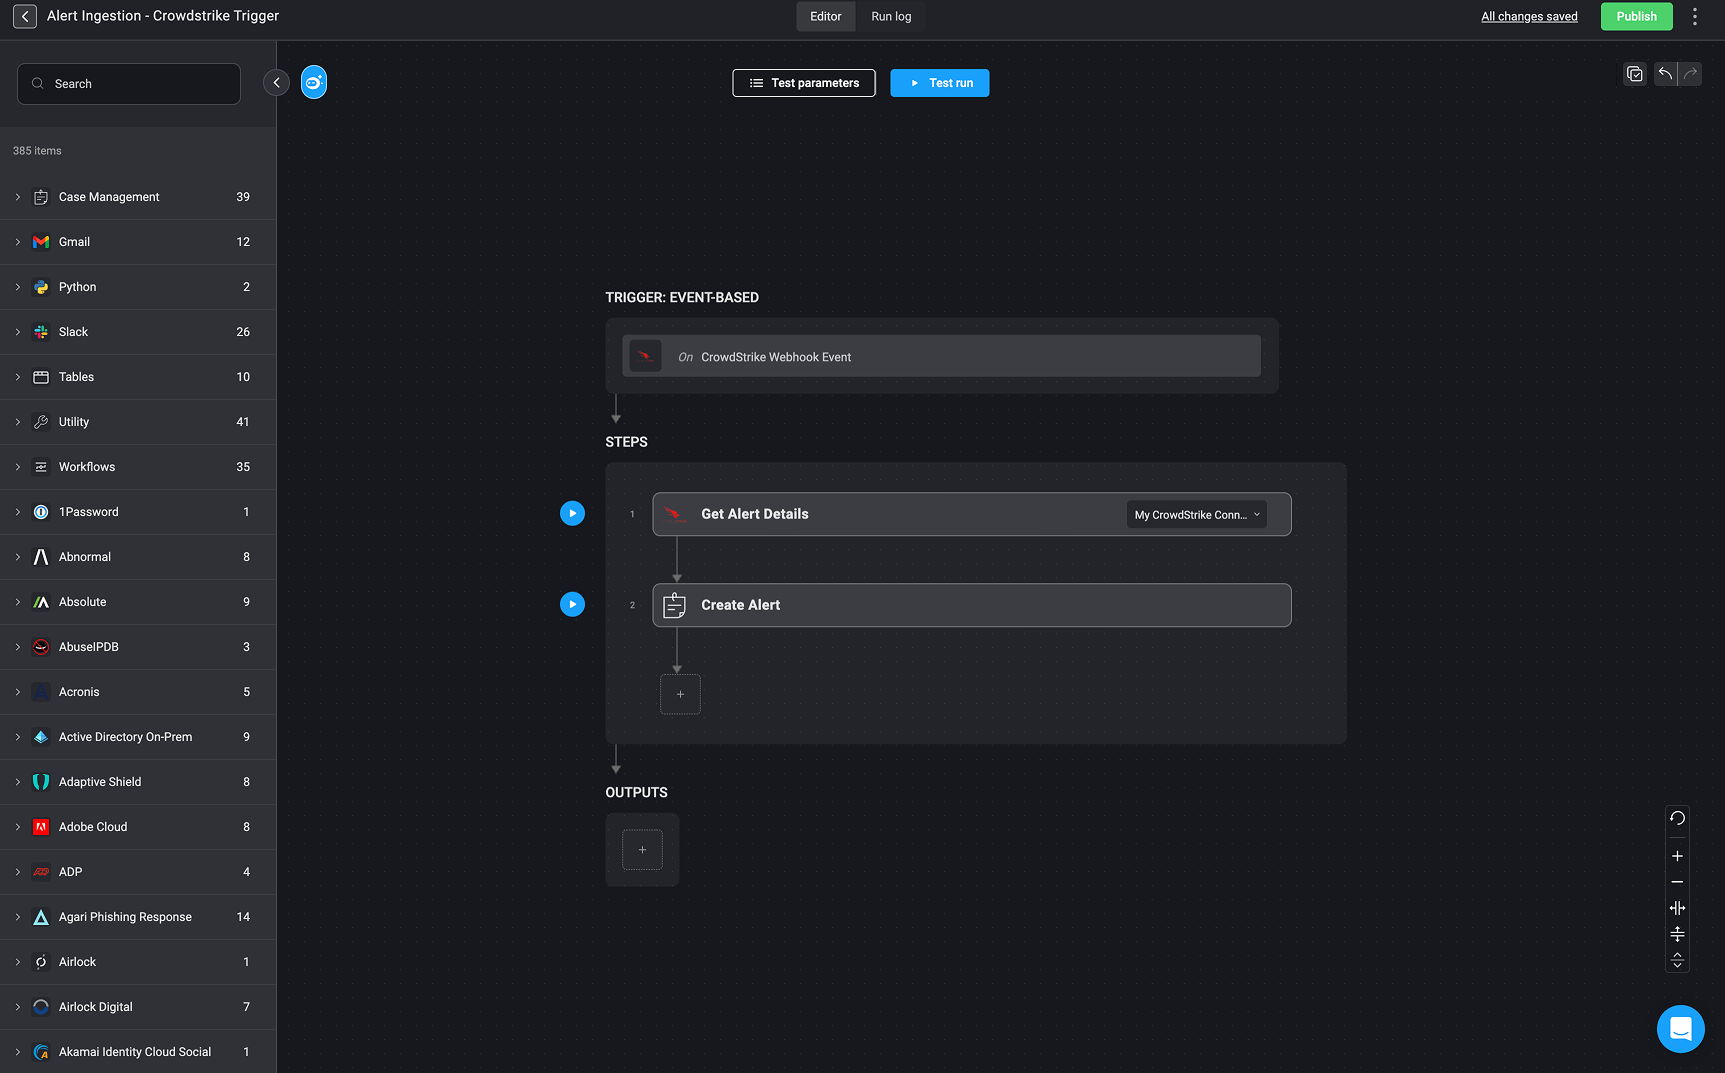
- Get Alert Details – Retrieves detailed information about the alert using the configured CrowdStrike connector.
- Create Alert – Uses the retrieved data to create a new alert record in the Alert Table
- From there, it proceeds to the next stage in the pipeline—Alert Processing, where additional alert analysis and case handling actions are performed.
Alert Payload Example
Alert Payload Example
Stage 2- Alert Processing
Stage 2- Alert Processing
Once the alert is recorded in the Alert Table, Blink continues the investigation by extracting meaningful data and observables.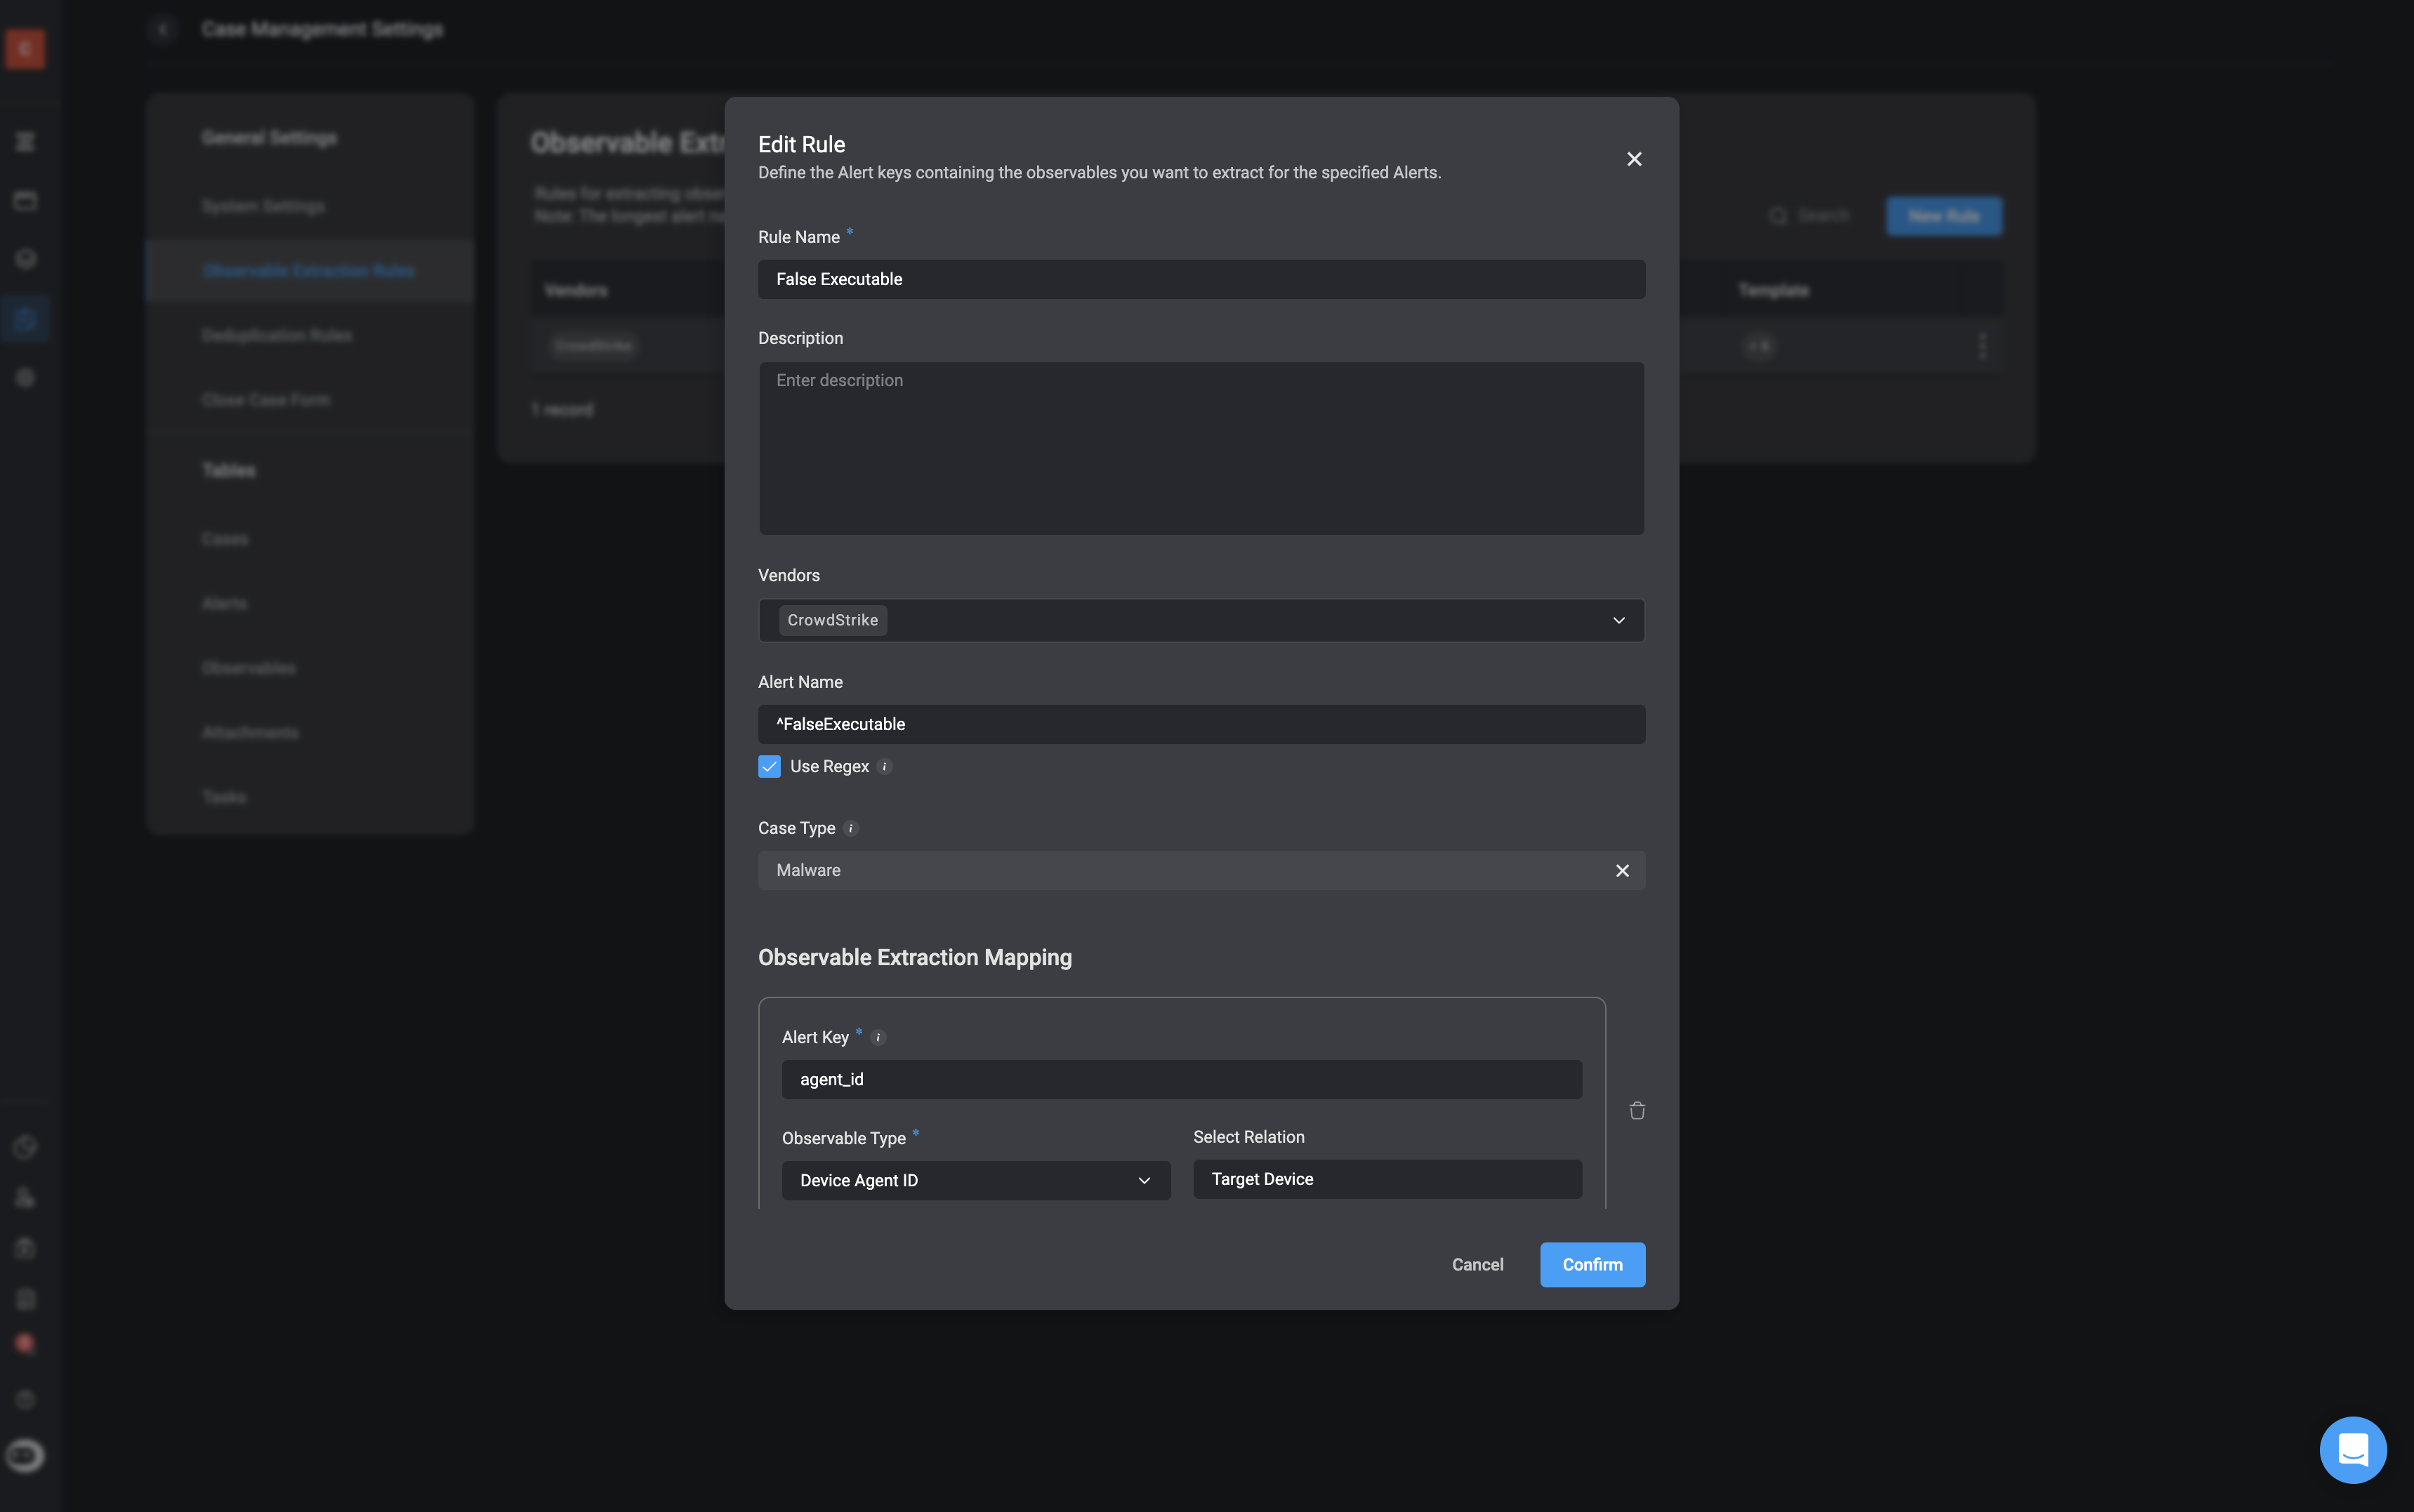
Create Observable Extraction Rules
- Description: Observable Extraction Rules are configured to define which data fields from the alert payload should be extracted and classified as observables and relations(if they exist).
- How it Works: These rules look into the alert’s structured data (JSON format) and match specific fields, such as agent_id, user_name, sha256, etc. Each extracted observable is then assigned a type (e.g., IP address, file hash) and a relation to the alert (e.g., Target Host, Attacker IP). This mapping helps define the scope of the threat and gives investigators a clearer view of how entities are related.
| Observable | Type | Explanation | Relation |
|---|---|---|---|
agent_id | Device Agent Id | Unique identifier for the CrowdStrike agent installed on the device. | Target Device |
device.external_ip | IP Address | The external/public IP address of the machine at the time of the alert. | Attacker IP Address |
device.hostname | Hostname | The hostname of the device involved in the detection. | Target Host |
device.local_ip | IP Address | The local/internal IP address of the endpoint. | Target IP Address |
parent_details.sha256 | File Hash | SHA256 hash of the parent process (zsh) that launched the suspicious file. | Parent Process Hash |
sha256 | File Hash | SHA256 hash of the child process that launched the suspicious file | No relation |
user_name | Username | The username (bart.s) associated with the user who executed the process | Target User |
user_name | Username | The username (root) associated with the grandparent process | Target User |
Note: Not all extracted observables will have observable relations, and defining such relationships is not mandatory. However, when relations exist—such as a file being associated with a specific IP address or command execution—these will be automatically extracted and identified as part of the process. This helps build a clearer picture of the attack chain and supports better investigation and response.
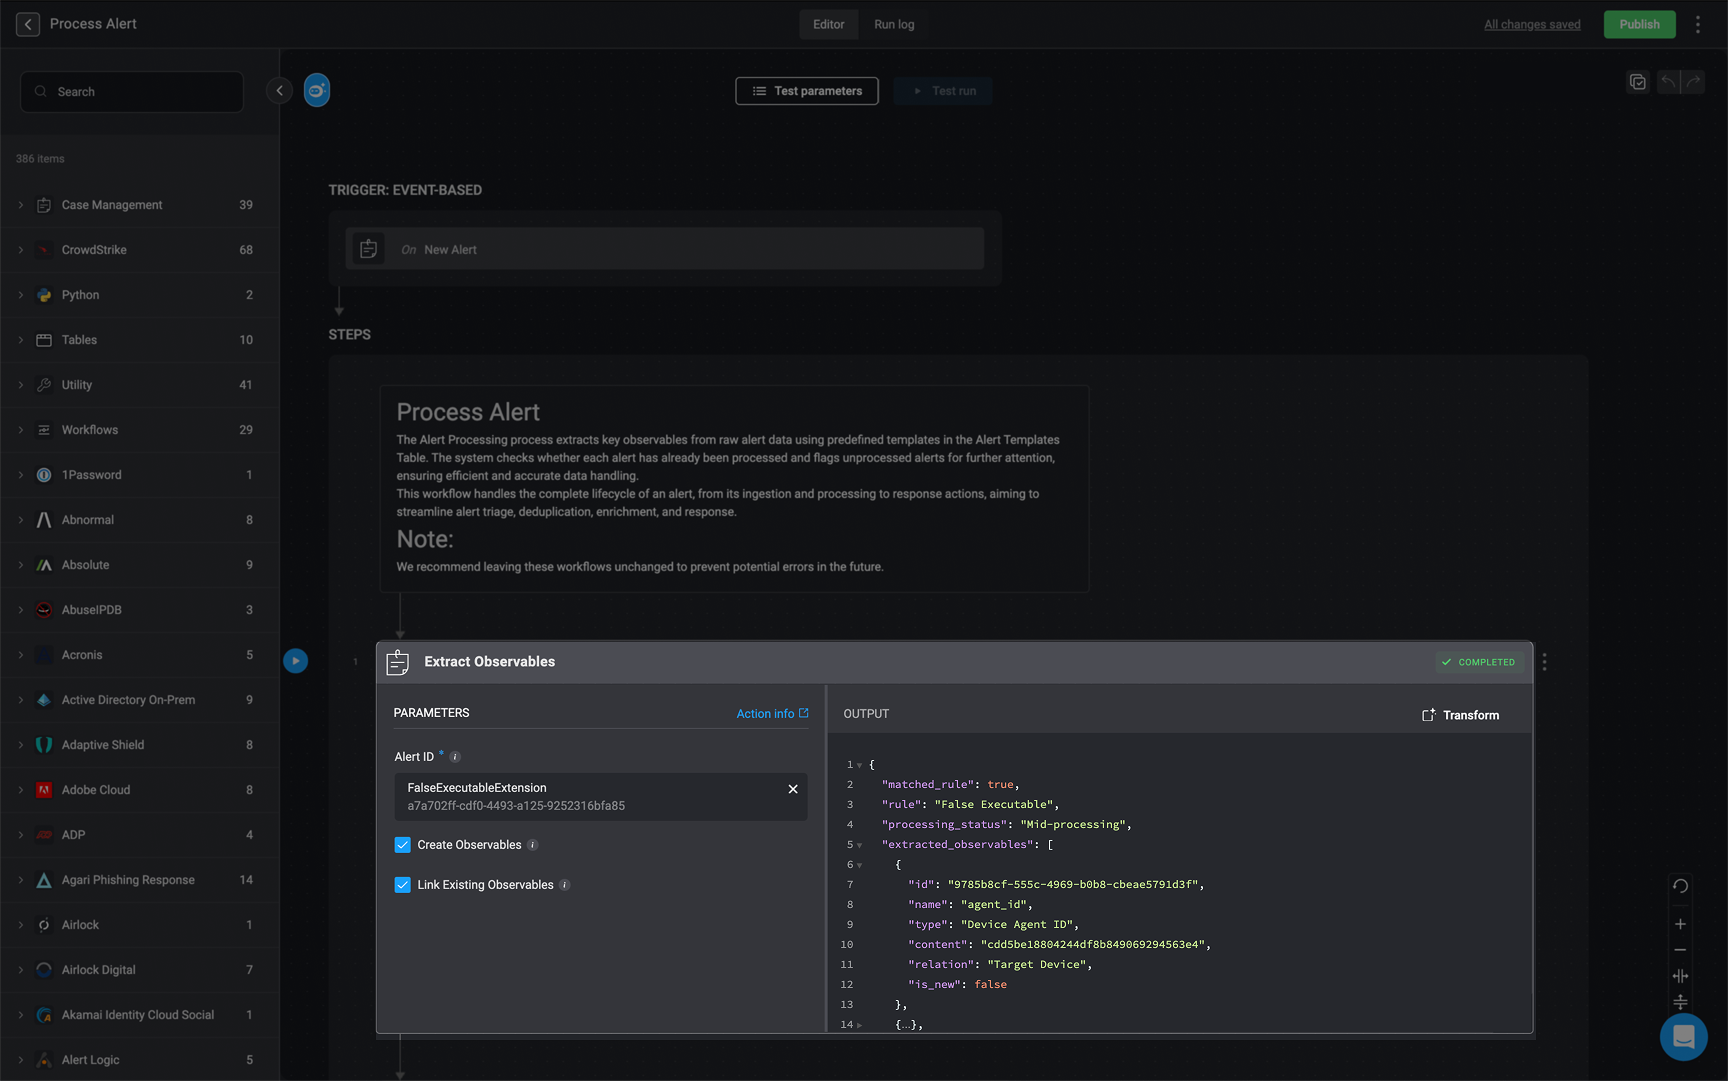
Execute the Extract Observable action
- Description: The Extract Observable action automatically identifies and stores key observables based on the configured rules.
- How it works:This action runs the extraction logic and outputs matched observables along with their context and relationships. The observables are stored in the Observables Table and are available for further enrichment or case correlation.
Example of `JSON` Ouput
Example of `JSON` Ouput
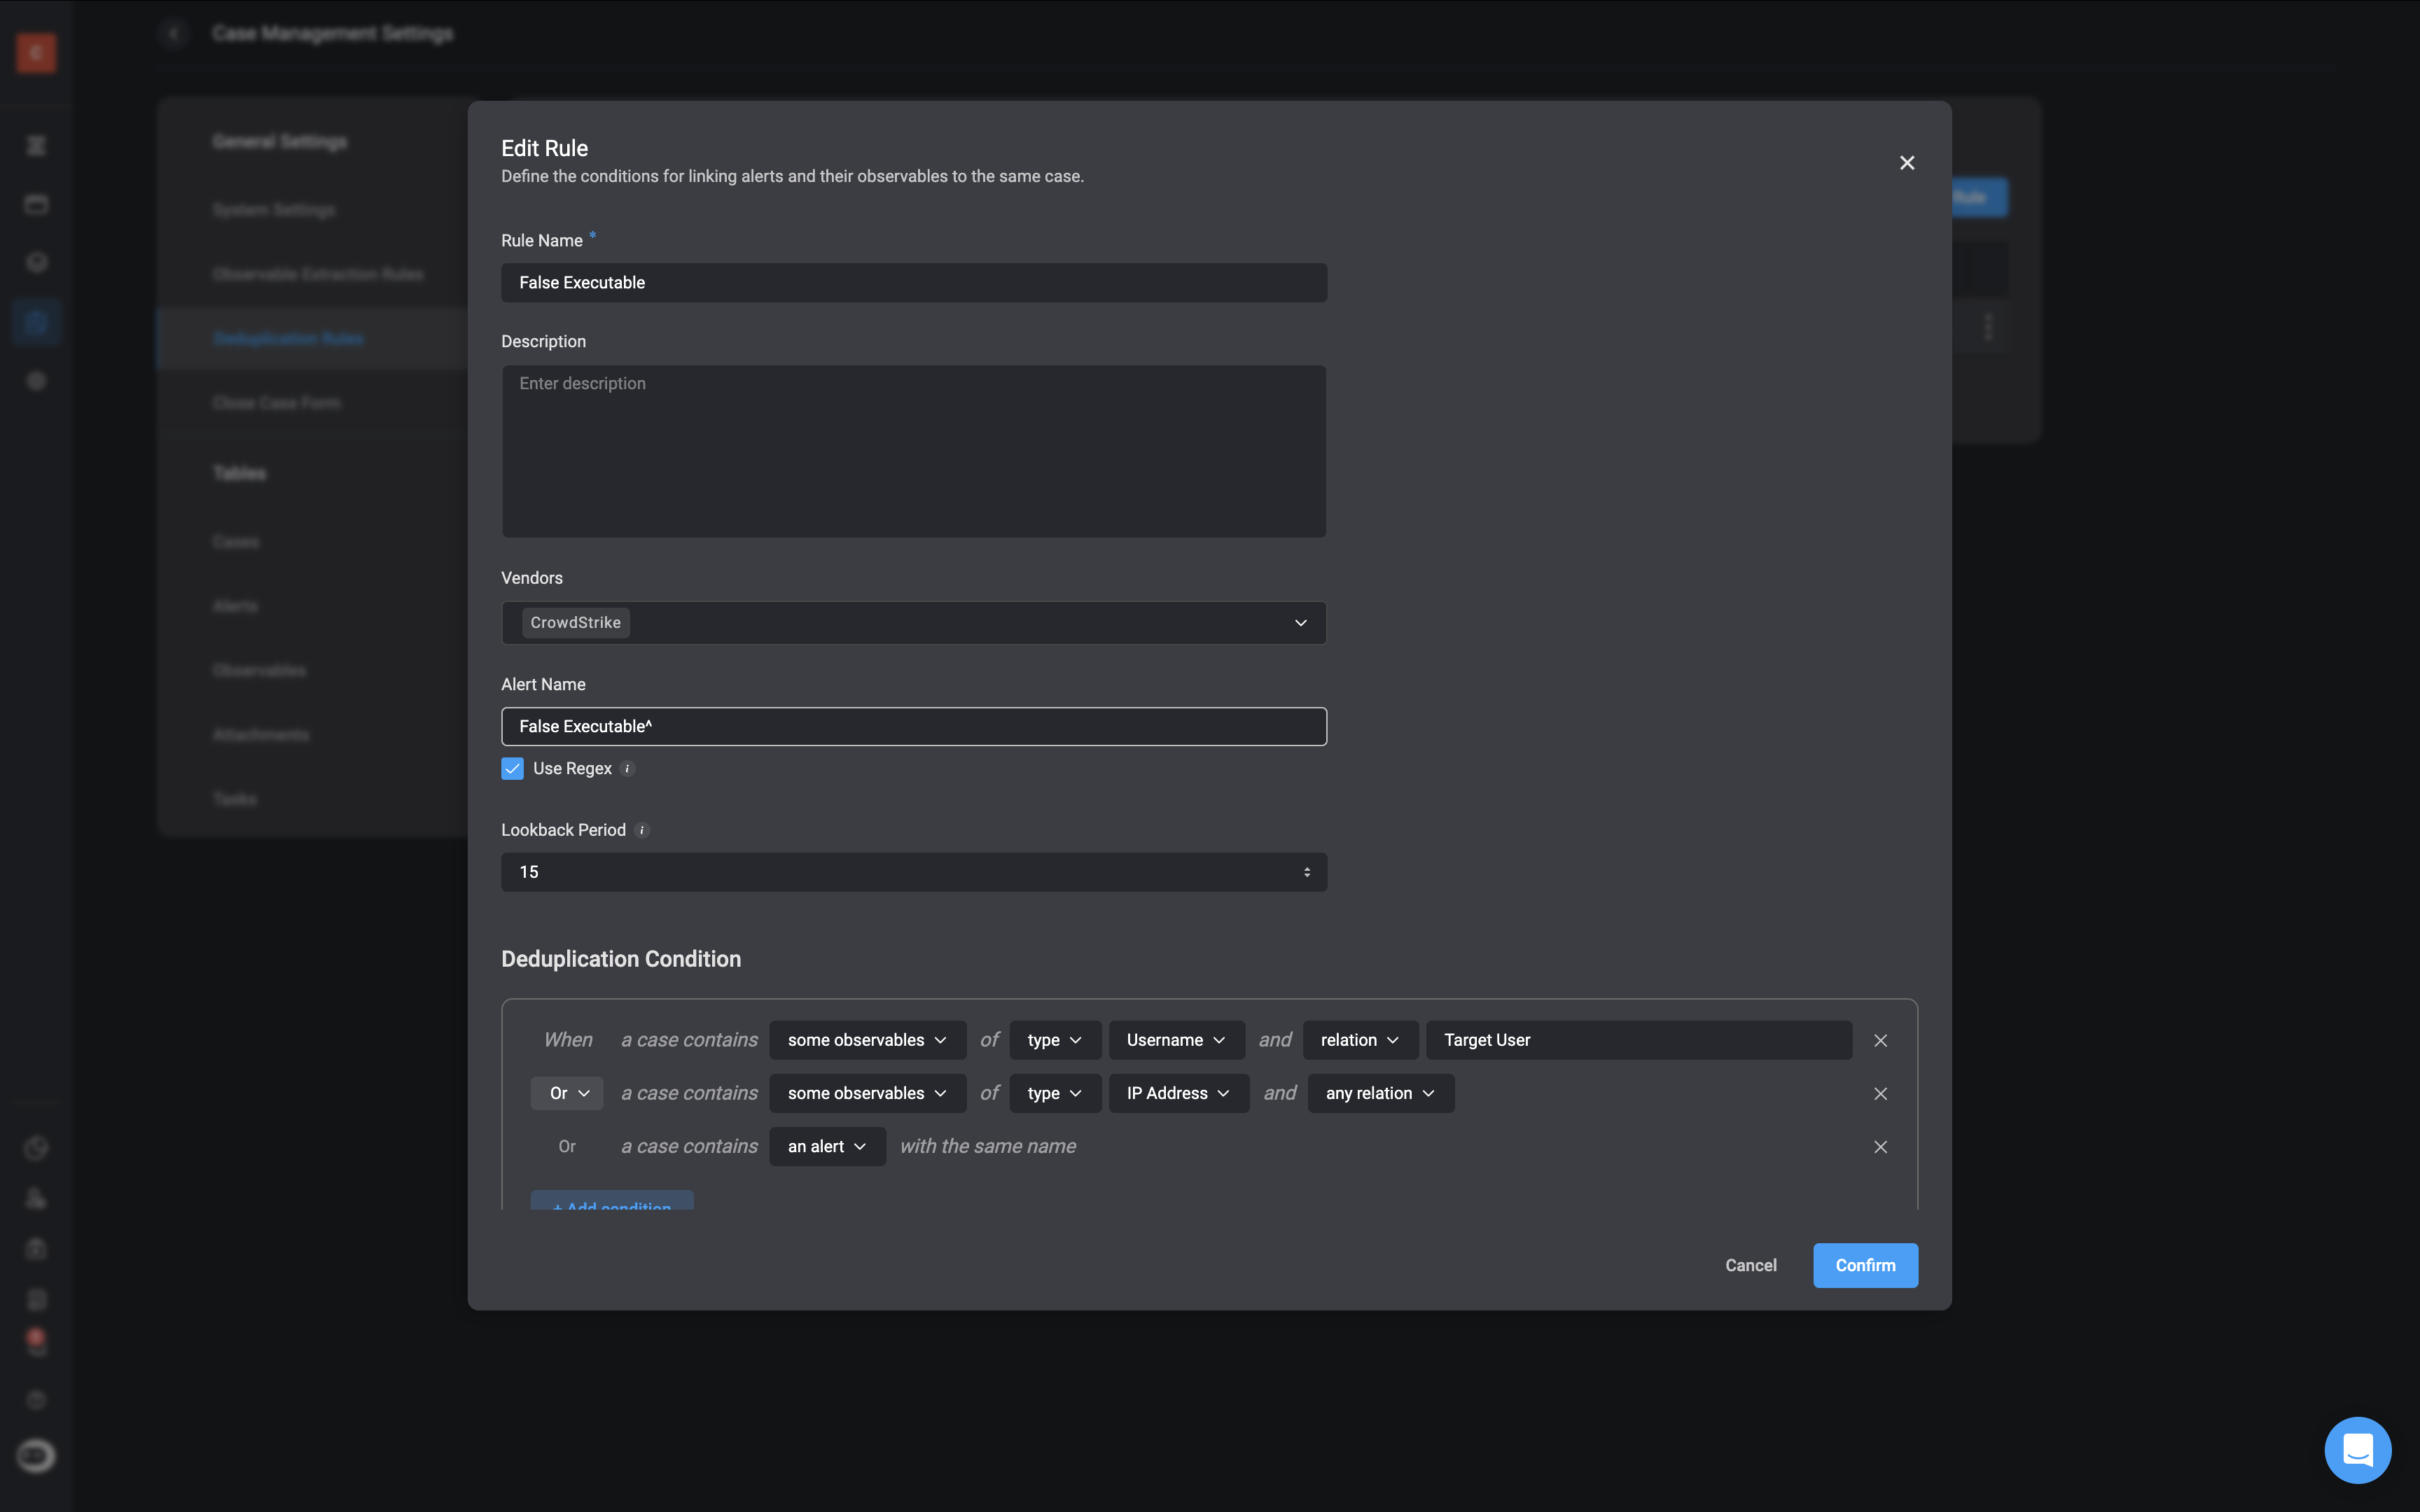
Create Deduplication Rules
- Description: Deduplication Rules define how Blink identifies alerts that are likely part of the same incident. These rules help avoid duplicate case creation and ensure incident responders have full context.
- How It Works: For every alert, Blink applies pre-defined or custom deduplication logic using key fields (such as filename, hash, host, tactic/technique). These rules match patterns across similar alerts to decide whether to group them into a single case.
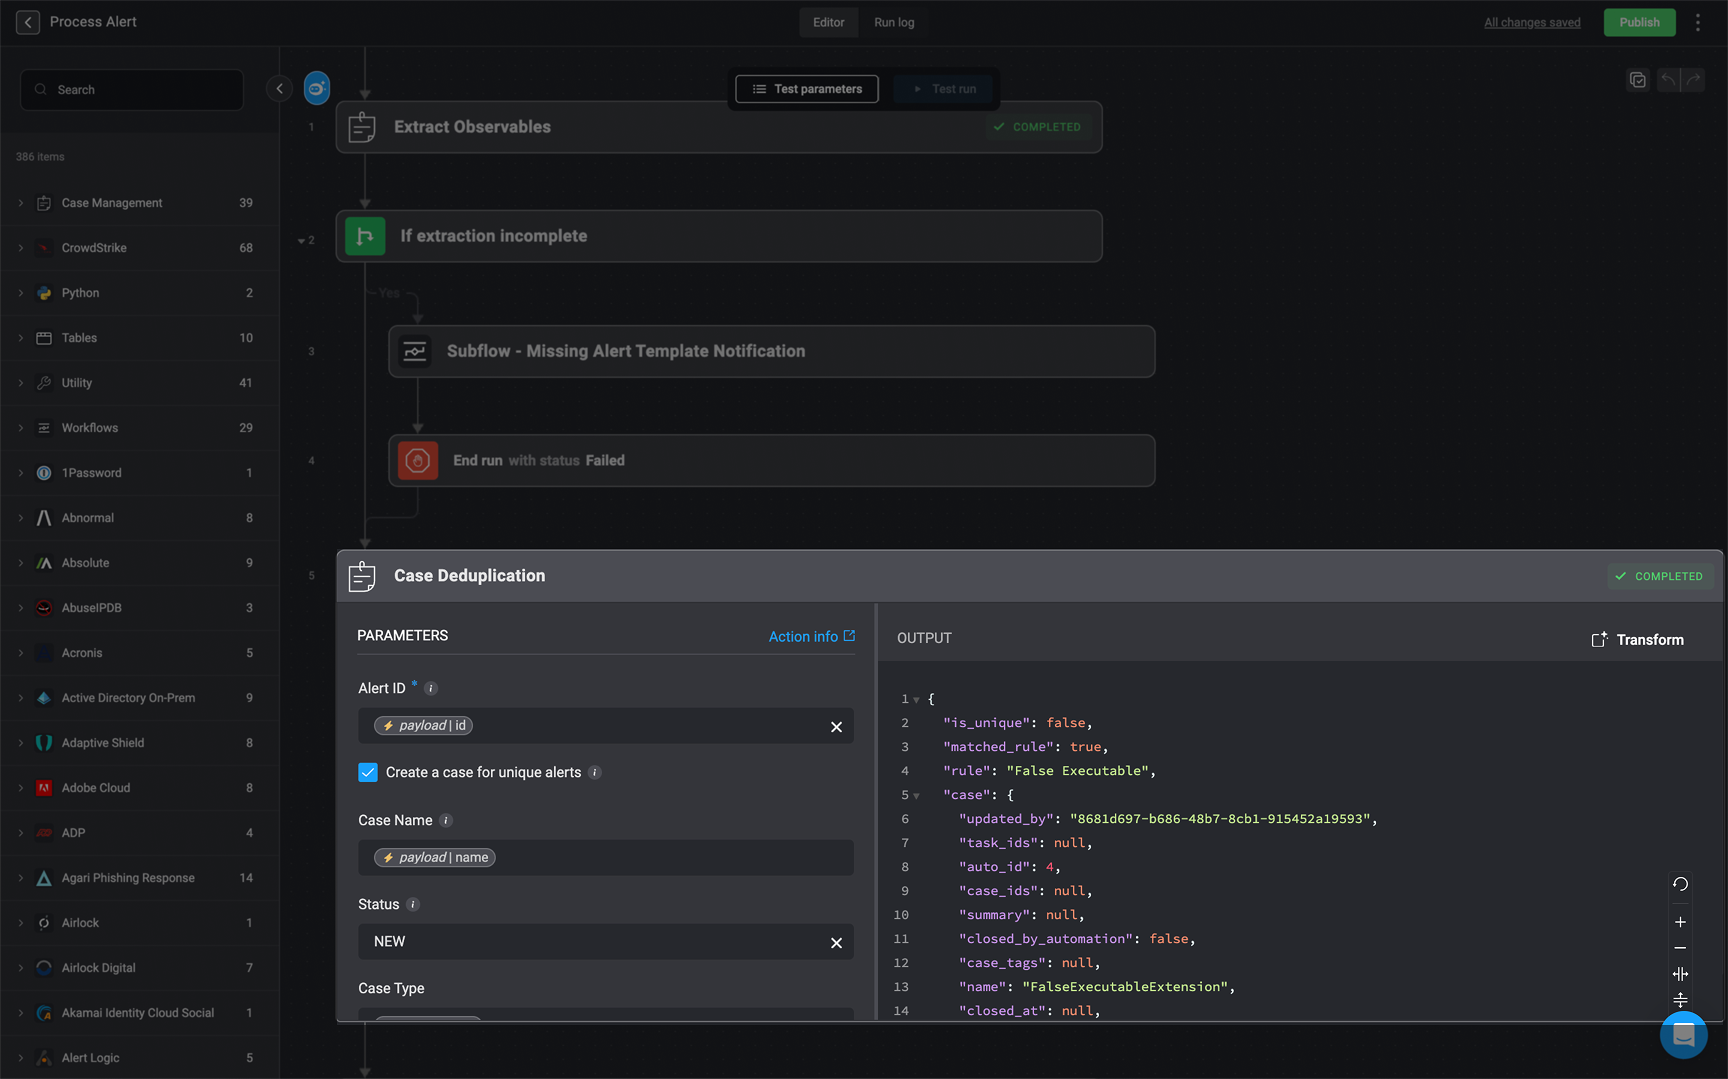
Execute the Case Deduplication action
- Description: Blink checks whether the current alert matches an existing case using deduplication logic. It then decides to either create a new case or append the alert to an existing one.
- How It Works:
- A deduplication rule (like False Executable) is applied to the incoming alert.
- If the alert matches an existing case, it is added to that case, updating the case’s observable and alert lists.
- If no match is found, a new case is created and populated with observables, alerts, and other metadata like severity, case type, and ID.
Example of `JSON` Ouput
Example of `JSON` Ouput
Stage 3-Enrich Observables
Stage 3-Enrich Observables
Description: This stage enriches any newly extracted observables to provide analysts with additional context during investigation.How It Works:
- This stage takes newly discovered observables listed in the new_observables field (as seen in the output from the Extract Observables step).
- Each observable’s type is automatically detected. In this example, the Agent Device observable type is detected.
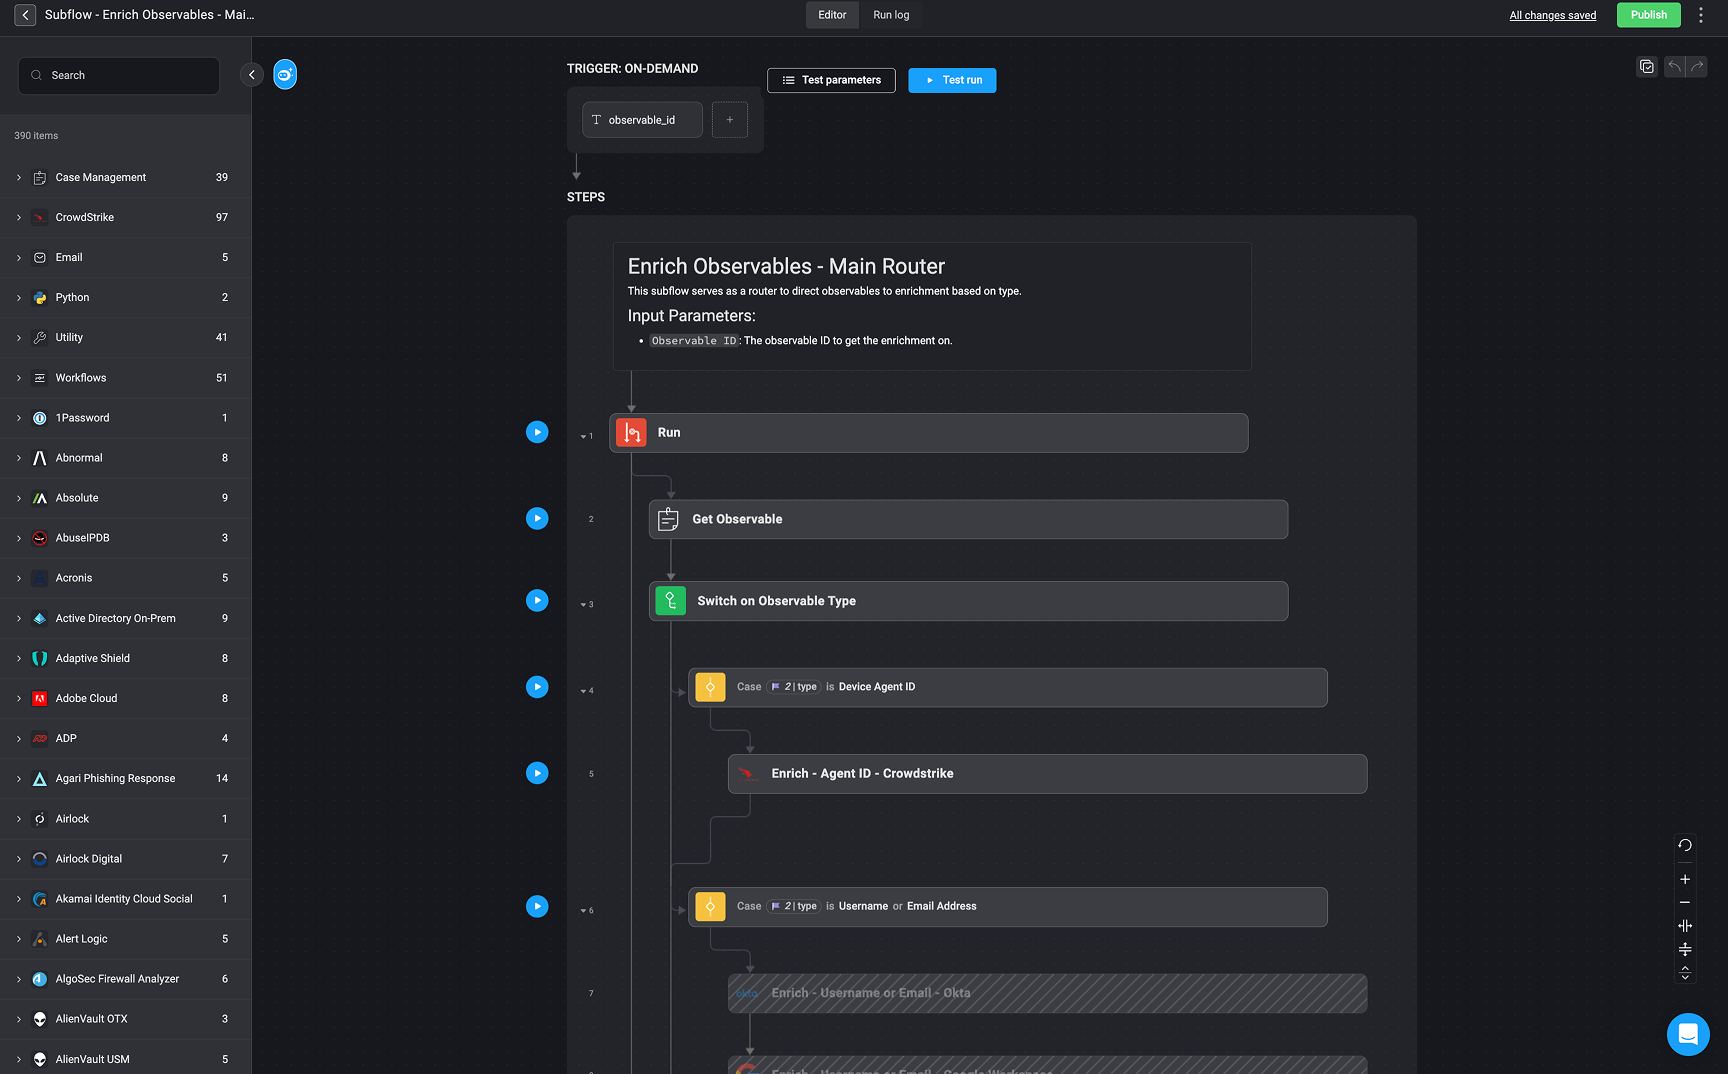
- Observables are passed to the Enrich Observables- Main Router, which dynamically routes them to the appropriate enrichment logic based on their type.ֿ
- The corresponding enrichment actions are then executed—each tailored to the specific observable type.
- the results are appended to the observable metadata and made available in the case for analyst review.
- The observable with type Device Agent ID (e.g., cdd5be18804244df8b849069294563e4) triggers the first case in the switch logic.
- This routes the observable to the CrowdStrike enrichment step (Enrich - Agent ID - CrowdStrike) to retrieve relevant device data.
Additional cases (not shown here) can be configured for usernames, file hashes, domains, and more. This approach ensures observables are enriched consistently and automatically, without requiring hardcoded paths for each case.
Example of `JSON` Ouput
Example of `JSON` Ouput
Stage 4- Response
Stage 4- Response
- Description: Blink triggers automated workflows to respond to the alert.
- How It Works:
- Workflows include actions such as blocking an IP, disabling a user account, or notifying a security team.
- Response steps are configured based on the severity and type of the alert.
- Triggered Action: Block IP address “192.168.1.1” via firewall.
- Workflow Execution Log: