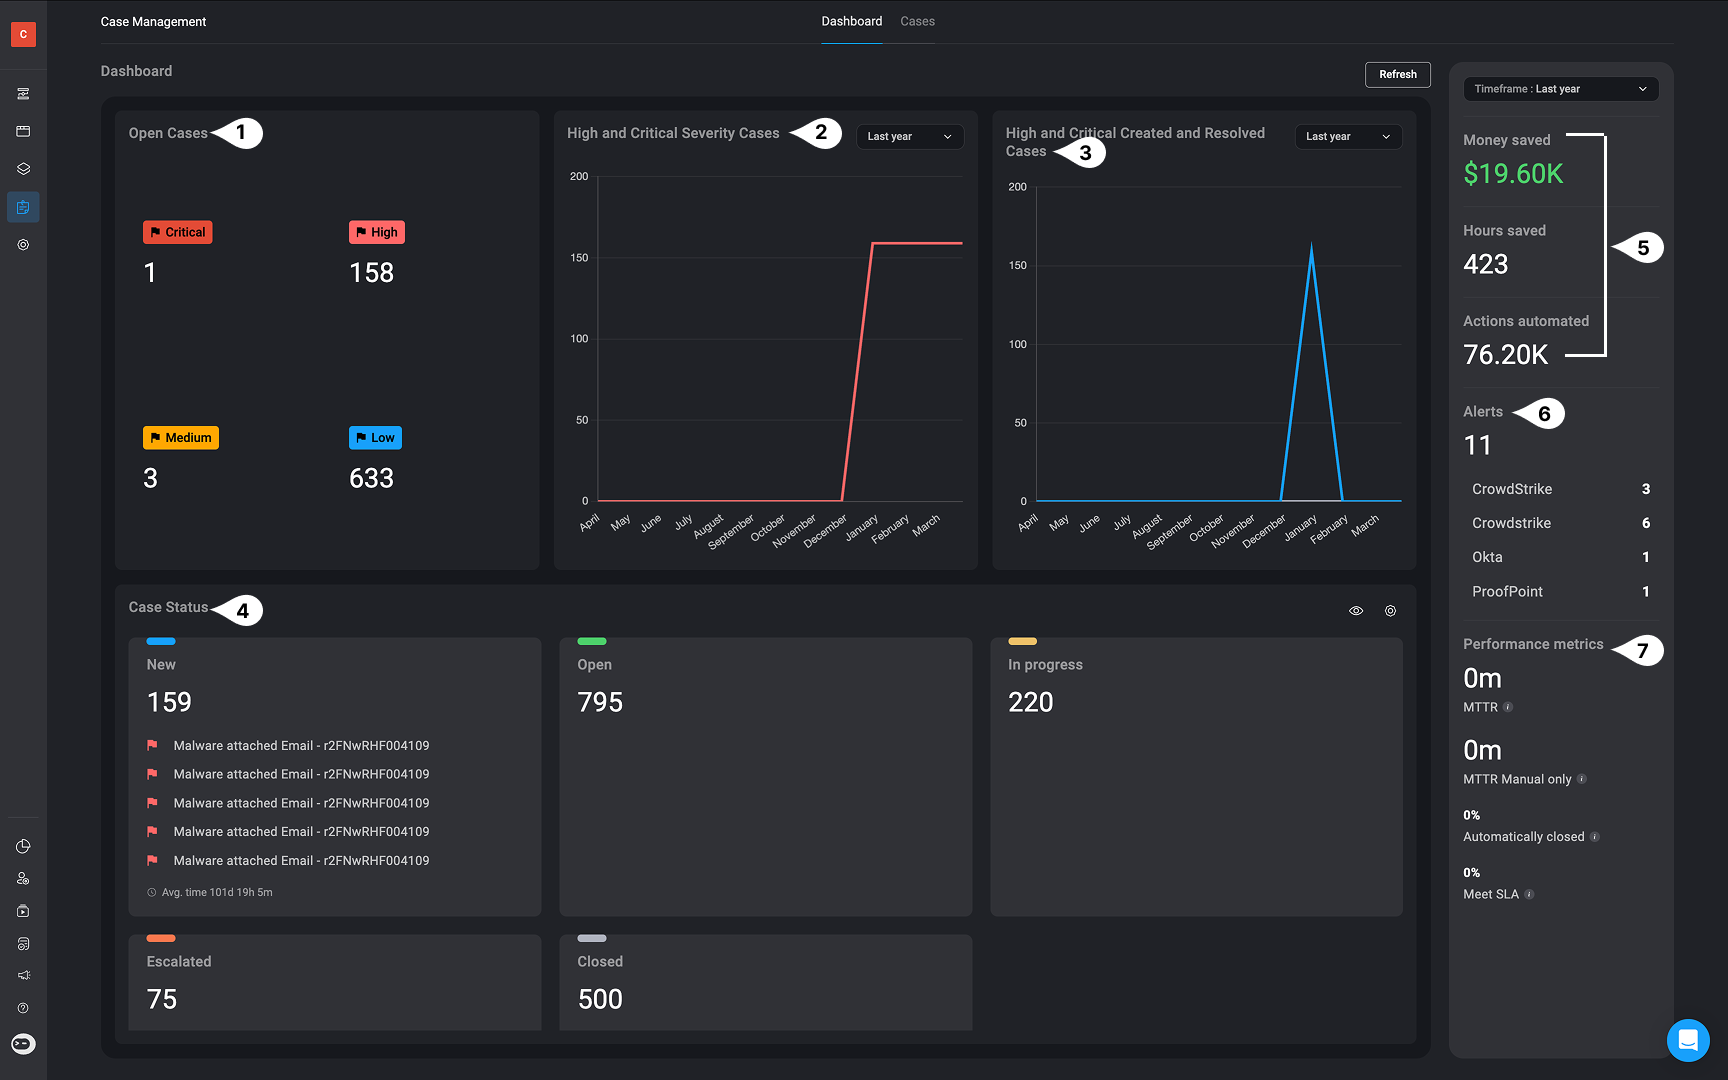
Component | Description | |
---|---|---|
1 | Open Cases | Displays the total number of open cases, organized by Critical, High, Medium, and Low severity levels. This provides a quick snapshot of the current case load by urgency. |
2 | High and critical severity cases | A line chart showing the number of active High and Critical severity cases over a selected time period. Use the timeframe dropdown to filter and view trends for different periods. |
3 | High and Critical Severity Cases Created and Resolved | A line chart showing how many High and Critical severity cases were created and resolved over a specified timeframe. Easily adjust the timeframe using the dropdown to analyze case flow trends. |
4 | Case Status’s- Open, In progress and Closed | Provides the current status breakdown of all cases, including New, Open, In Progress, Escalated, and Closed cases. Includes average time spent in each status to help monitor case handling efficiency. |
5 | Money Saved and Time Saved and Actions Automated | Summarizes the cost savings, hours saved, and automated actions achieved through Case Management. Adjust the timeframe to view ROI for different periods |
6 | Alerts | Displays the total number of alerts processed, along with a breakdown by vendor (such as CrowdStrike, Okta, ProofPoint) to show where alerts are coming from. |
7 | Performance Metrics | Key performance indicators including MTTR-(the average time it takes to resolve a case), Manual MTTR-(the average resolution time excluding cases that were closed automatically), percentage of automatically closed cases, and SLA compliance rates. Useful for evaluating team efficiency and process effectiveness. |