Note: Only users with the Tenant Admin role have permission to access this Dashboard
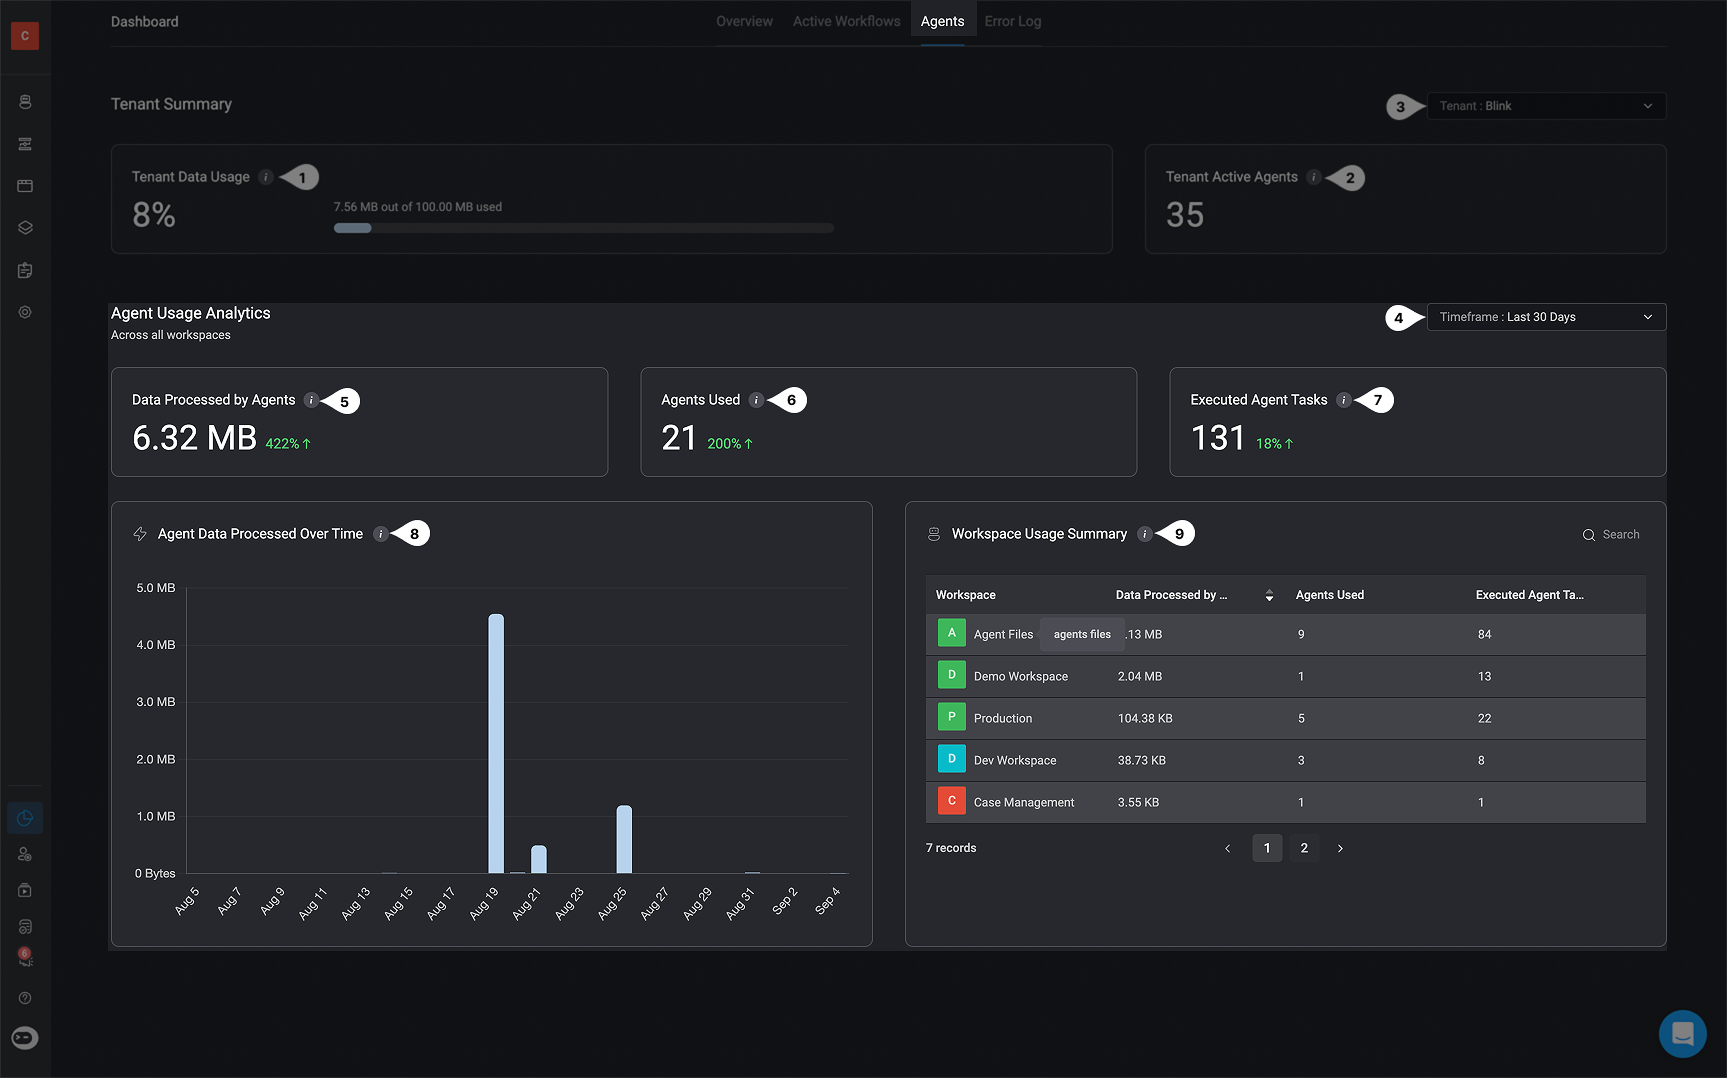
- Track total data processed by agents across your tenant.
- See how many agents are active and in use.
- Measure executed tasks and data trends over time.

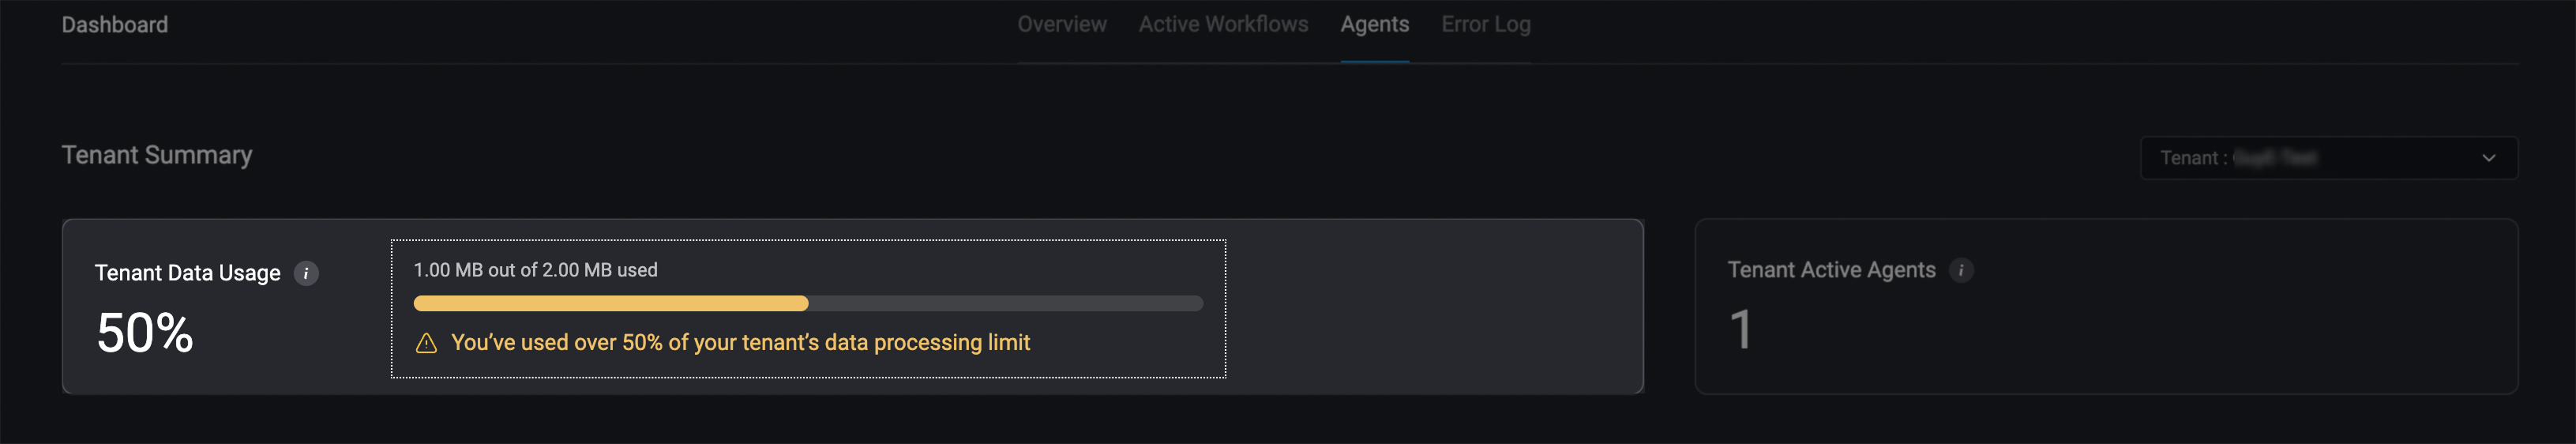
Automatic Quota Threshold Alerts
Email notifications are sent to all tenant admins at the following thresholds:- 50%
- 75%
- 90%
- Blocked (when the tenant’s licensed data quota has been reached)

Tenant Summary

Title | Description | |
---|---|---|
1 | Tenant Data Usage | Total data processed by agents across all workspaces in your tenant out of the total licensed quota. |
2 | Tenant Active Agents | Number of enabled agents available across all workspaces in this tenant. |
3 | Tenant | Dropdown to filter and view agent data specific to a selected tenant |
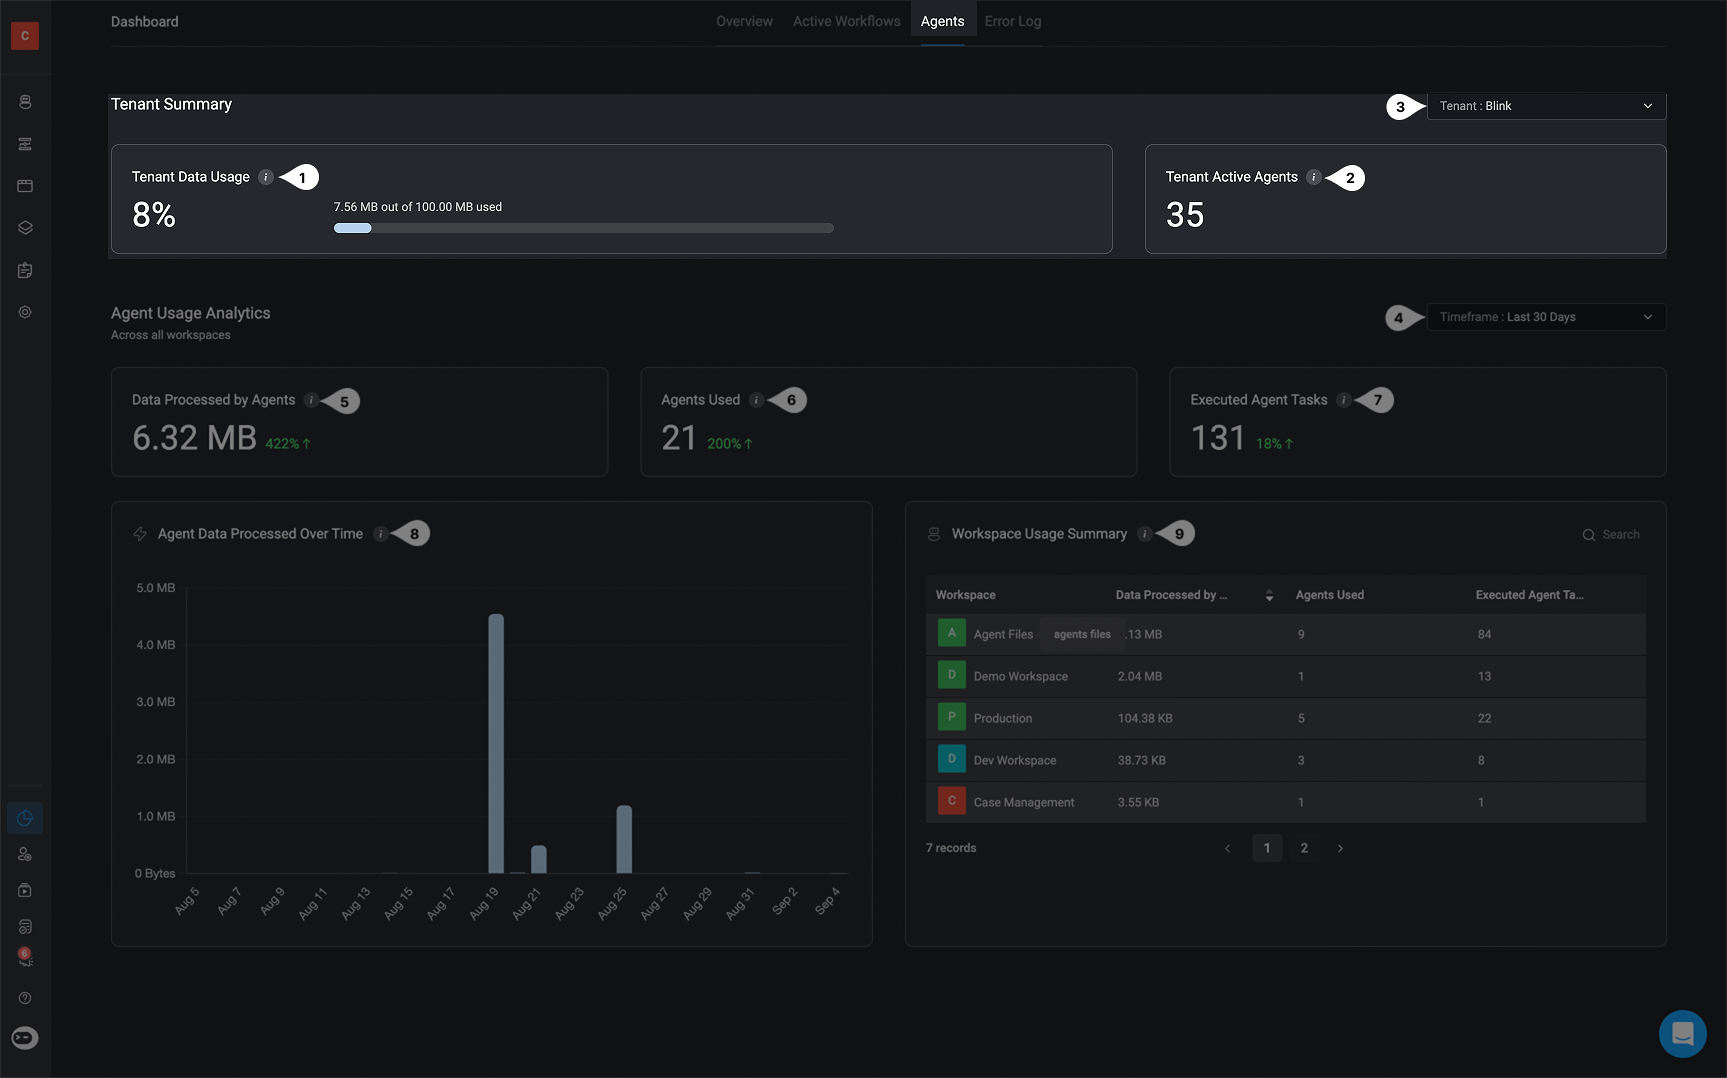
Agent Usage Analytics - Across All Workspaces

Title | Description | |
---|---|---|
4 | Timeframe | Allows you to define the timeframe for the data displayed (e.g., last 7 days, last 30 days). |
5 | Data Processed by Agents (across all workspaces) | Total data processed by agents in the selected time period. |
6 | Agents Used (across all workspaces) | Number of agents that ran at least once in the selected time period |
7 | Executed Agent Tasks (across all workspaces) | Total number of times an agent task was executed in the selected time period. |
8 | Agent Data Processed Over Time (across all workspaces) | Trend of data processed by agents over the selected time period. Helps visualize usage patterns and peaks |
9 | Workspace Usage Summary | Shows agent activity and data usage per workspace for the selected time period. |