> ## Documentation Index
> Fetch the complete documentation index at: https://docs.blinkops.com/llms.txt
> Use this file to discover all available pages before exploring further.

# Flow Chart

> Instructions on how to create and use the Flow Chart Widget

## Adding a Flow Chart Widget

<Steps>
  <Step title="Add a Widget to the Dashboard">
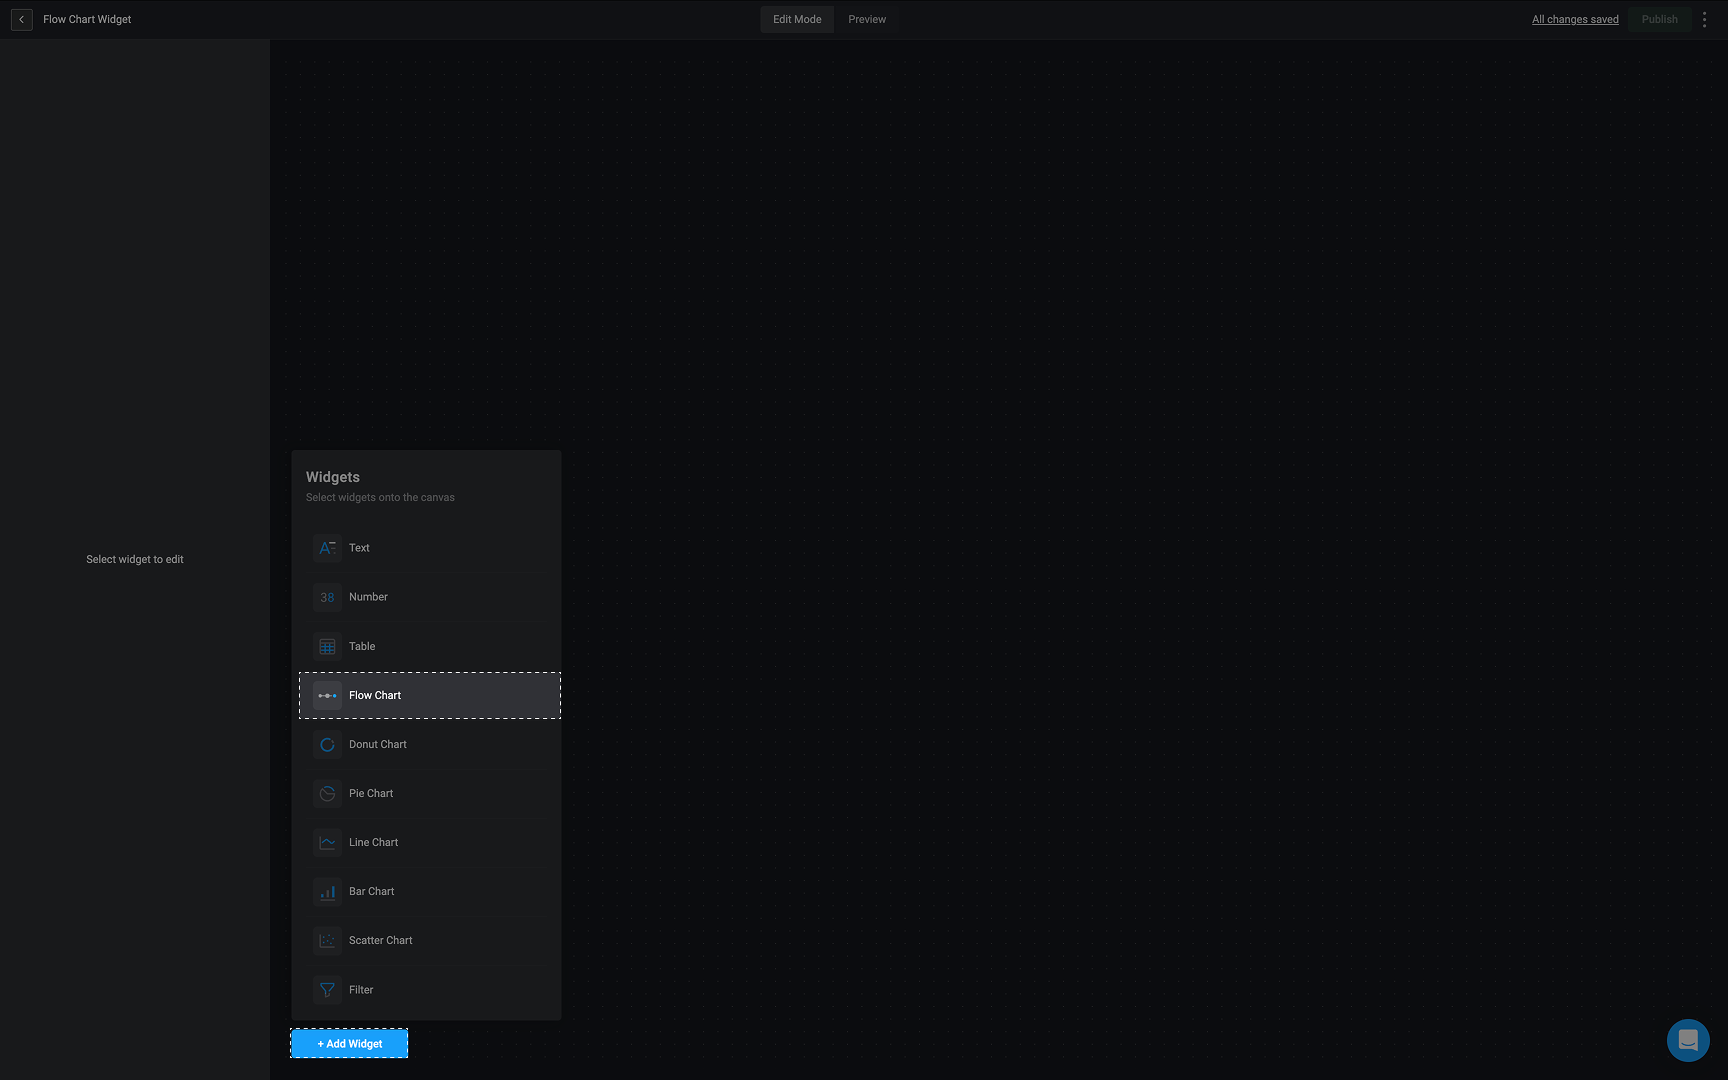
    In the *Edit Mode* tab of the Dashboards Building Interface, click the "add a widget" button and select the 'Flow Chart' widget.

    <Frame>
      <img src="https://mintcdn.com/blinkops-2/vgwh-xBl-obQz3Md/img/Dashboards/AddFlowChartWidget.png?fit=max&auto=format&n=vgwh-xBl-obQz3Md&q=85&s=773d1e2ddb3ce313cf9fe727fabe1d4f" width="1728" height="1080" data-path="img/Dashboards/AddFlowChartWidget.png" />
    </Frame>
  </Step>

  <Step title="Name Your Widget">
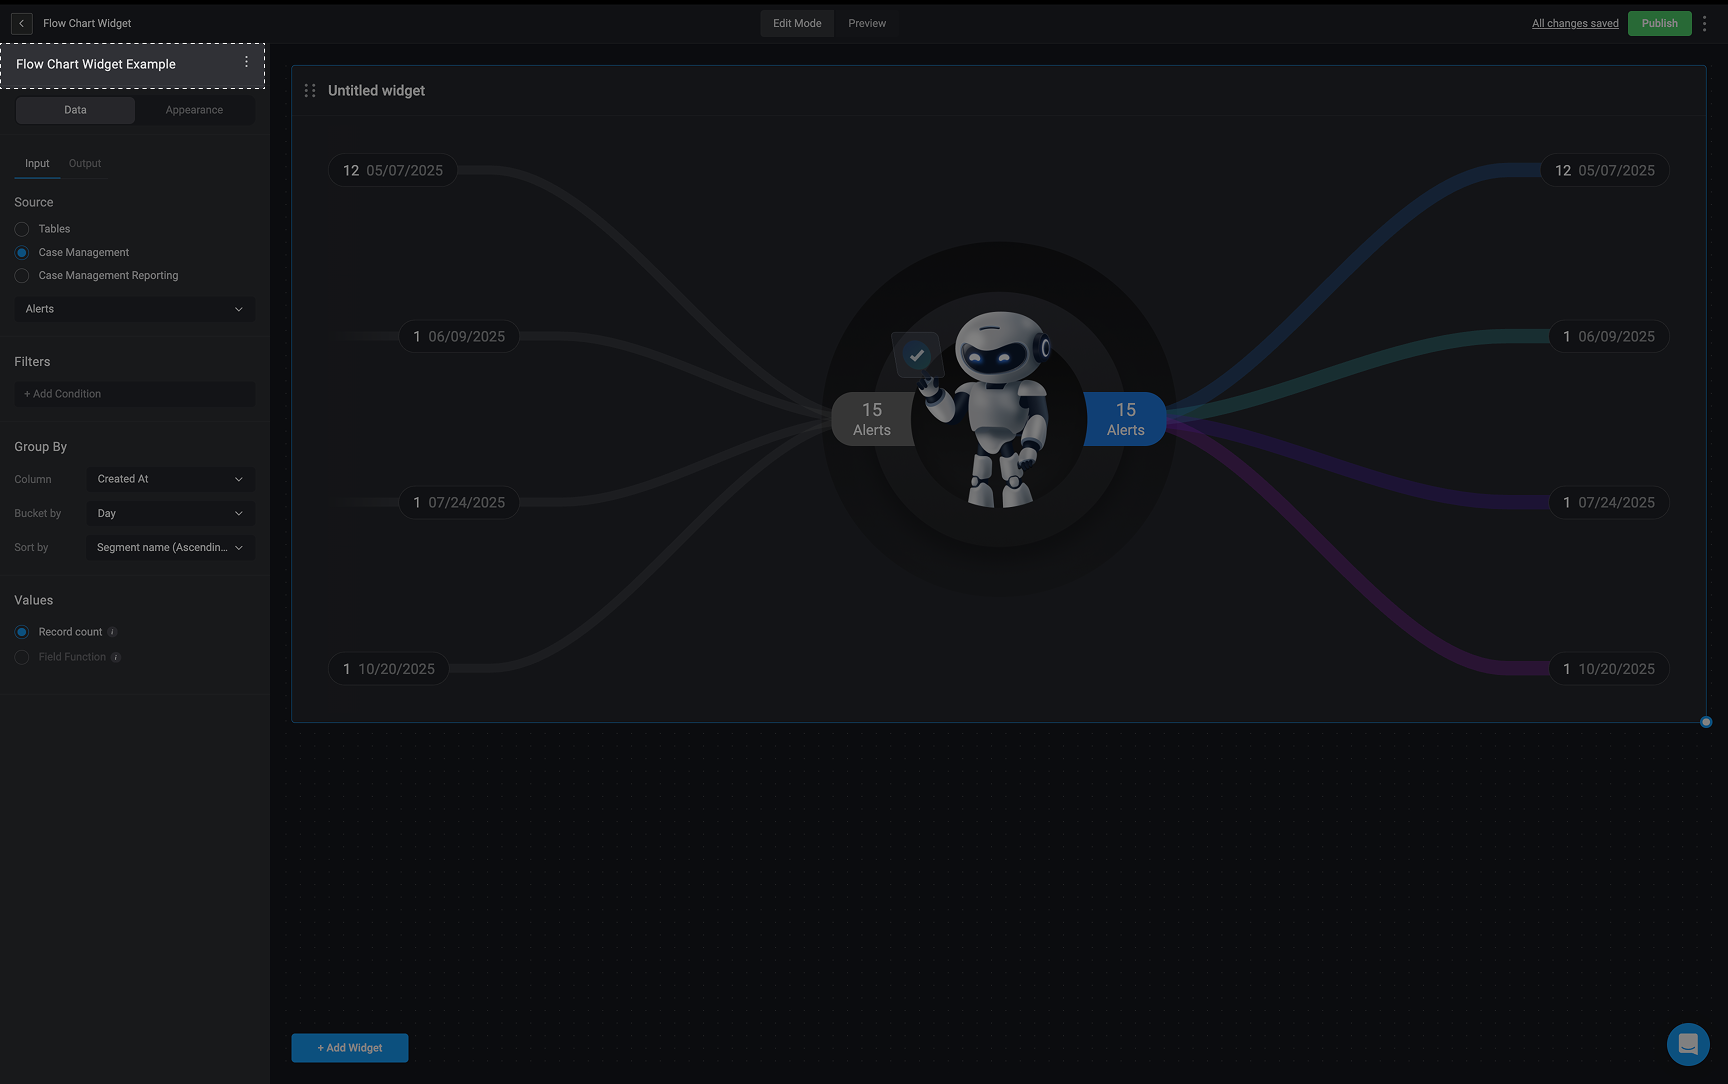
    In the sidebar in the top left corner, double-click on *Untitled widget* and provide a name for the selected widget.

    <Frame>
      <img src="https://mintcdn.com/blinkops-2/DwimBPb6OWmNXCv9/img/Dashboards/RenameFlowChartWidget.png?fit=max&auto=format&n=DwimBPb6OWmNXCv9&q=85&s=c5895f9981661227aa8c2d0e71b5b63f" width="1728" height="1084" data-path="img/Dashboards/RenameFlowChartWidget.png" />
    </Frame>
  </Step>

  <Step title="Configure the Input and Output">
    <Tabs>
      <Tab title="Input">
        <Step title="Choose a Data Source for the Input" stepNumber="3.1">
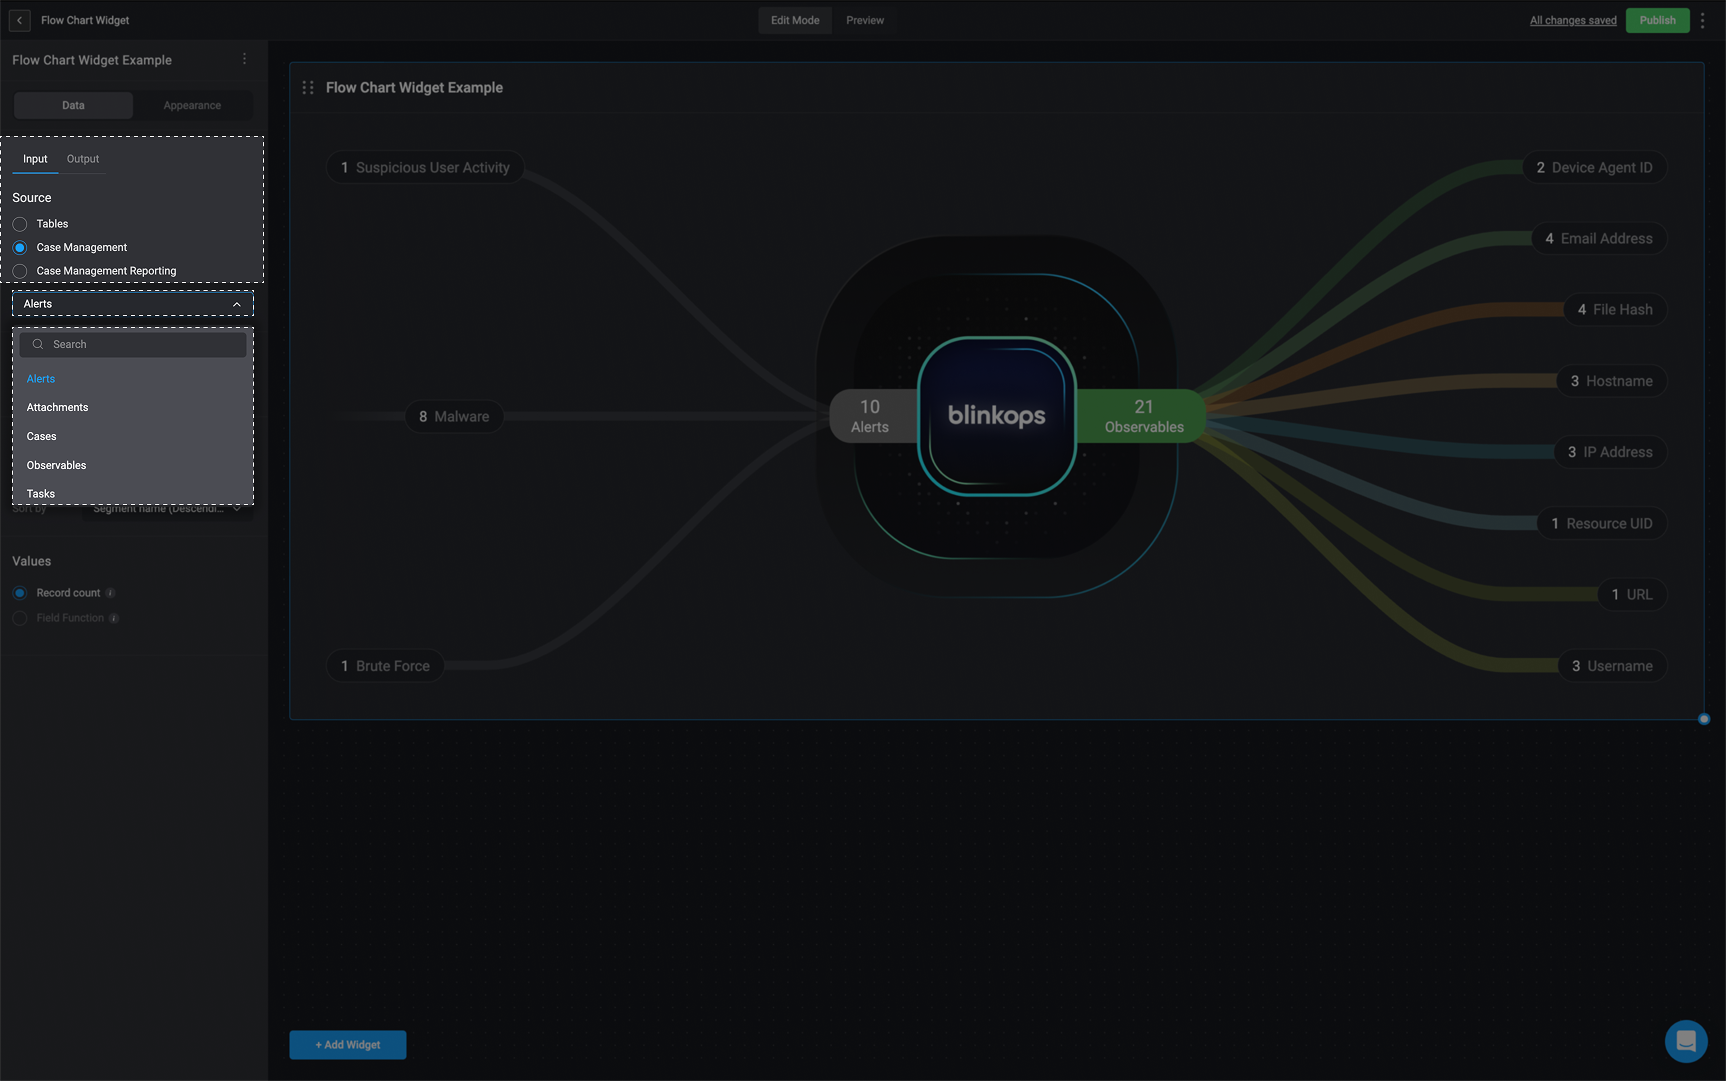
          Choose a data source: [Tables](/docs/blink-platform/tables/tables), [Case Management Tables](/docs/case-management/manage-tables) or [Case Management Reportings](/docs/blink-platform/dashboards/building-a-dashboard/source-types/case-management-reporting) and proceed by selecting the specific table column from the data source you would like to use.

          <Frame>
            <img src="https://mintcdn.com/blinkops-2/JG8fU3ZvfN8rpRf-/img/Dashboards/DataSourceFlowChart.png?fit=max&auto=format&n=JG8fU3ZvfN8rpRf-&q=85&s=bf944d7cfa9e006e978836b990028da0" width="1726" height="1081" data-path="img/Dashboards/DataSourceFlowChart.png" />
          </Frame>
        </Step>
      </Tab>

      <Tab title="Output">
        <Step title="Choose a Data Source for the Output" stepNumber="3.1">
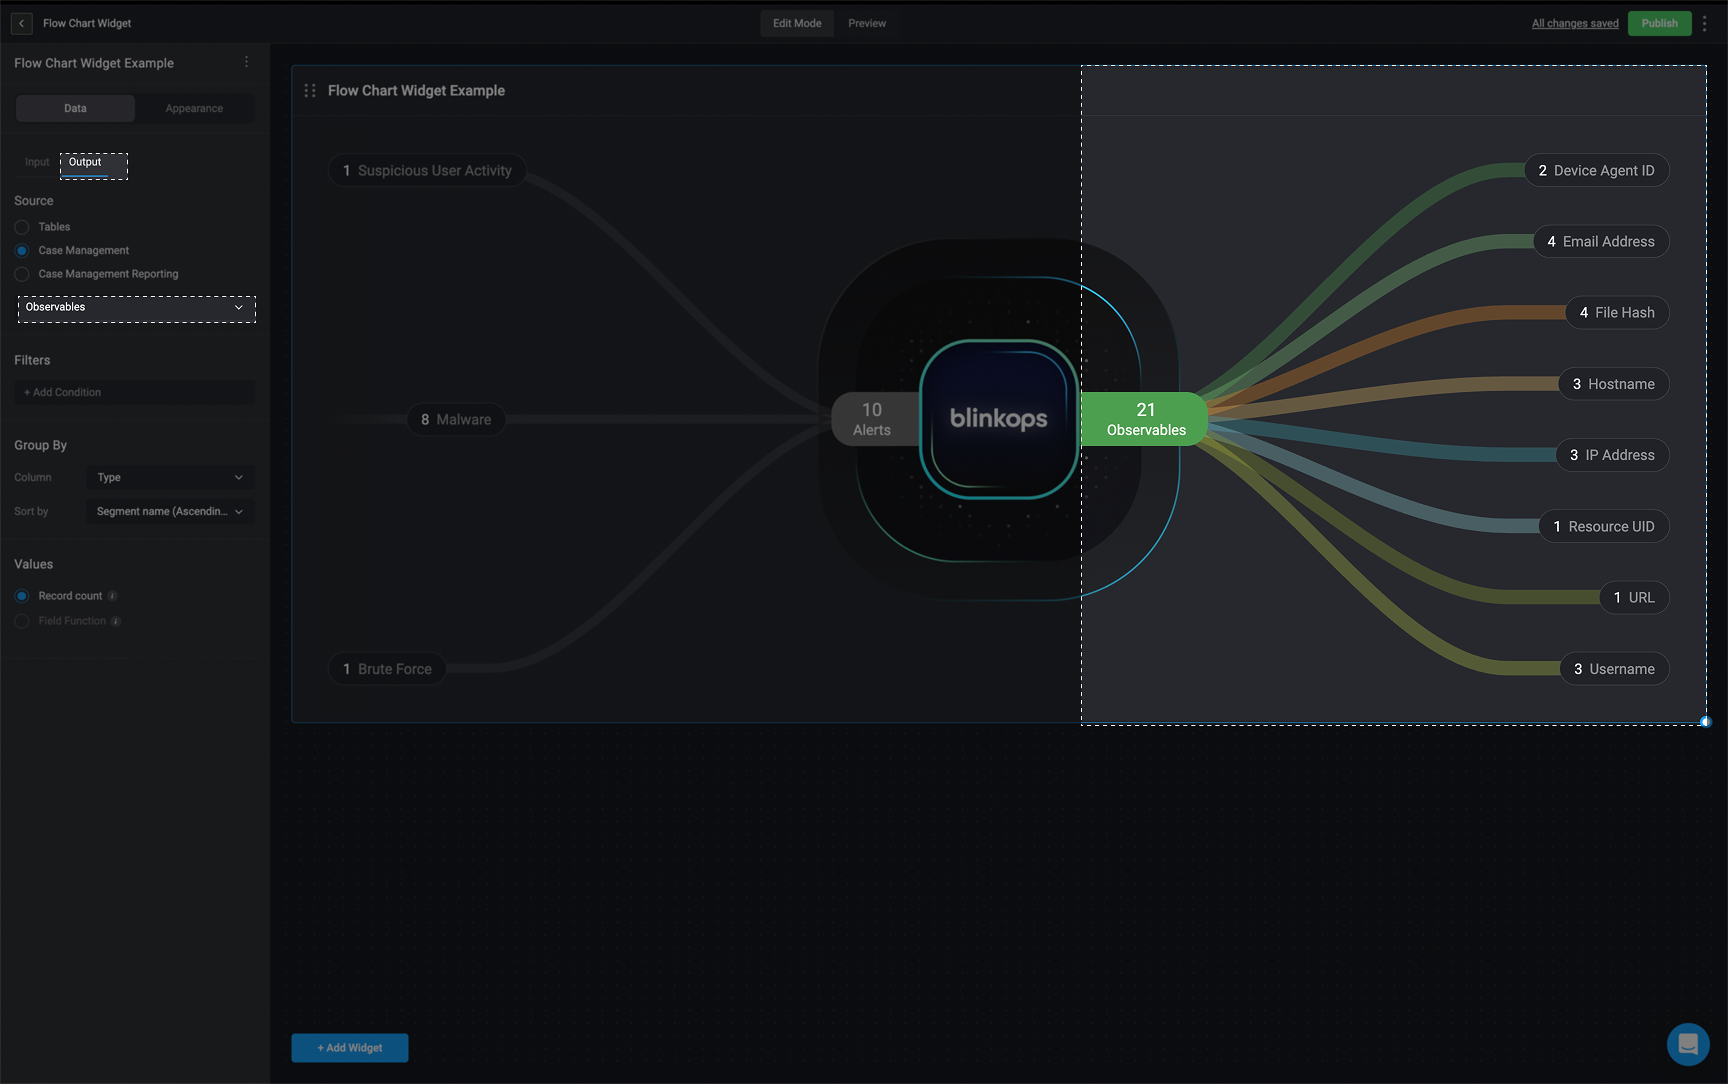
          Choose a data source: [Tables](/docs/blink-platform/tables/tables), [Case Management Tables](/docs/case-management/manage-tables) or [Case Management Reportings](/docs/blink-platform/dashboards/building-a-dashboard/source-types/case-management-reporting) and proceed by selecting the specific table column from the data source you would like to use.

          <Frame>
            <img src="https://mintcdn.com/blinkops-2/sNRSsm2uF-0J6IVJ/img/Dashboards/FlowChartOutput.png?fit=max&auto=format&n=sNRSsm2uF-0J6IVJ&q=85&s=3b45e10d865a4fb93f01cd39641c3158" width="1728" height="1084" data-path="img/Dashboards/FlowChartOutput.png" />
          </Frame>
        </Step>

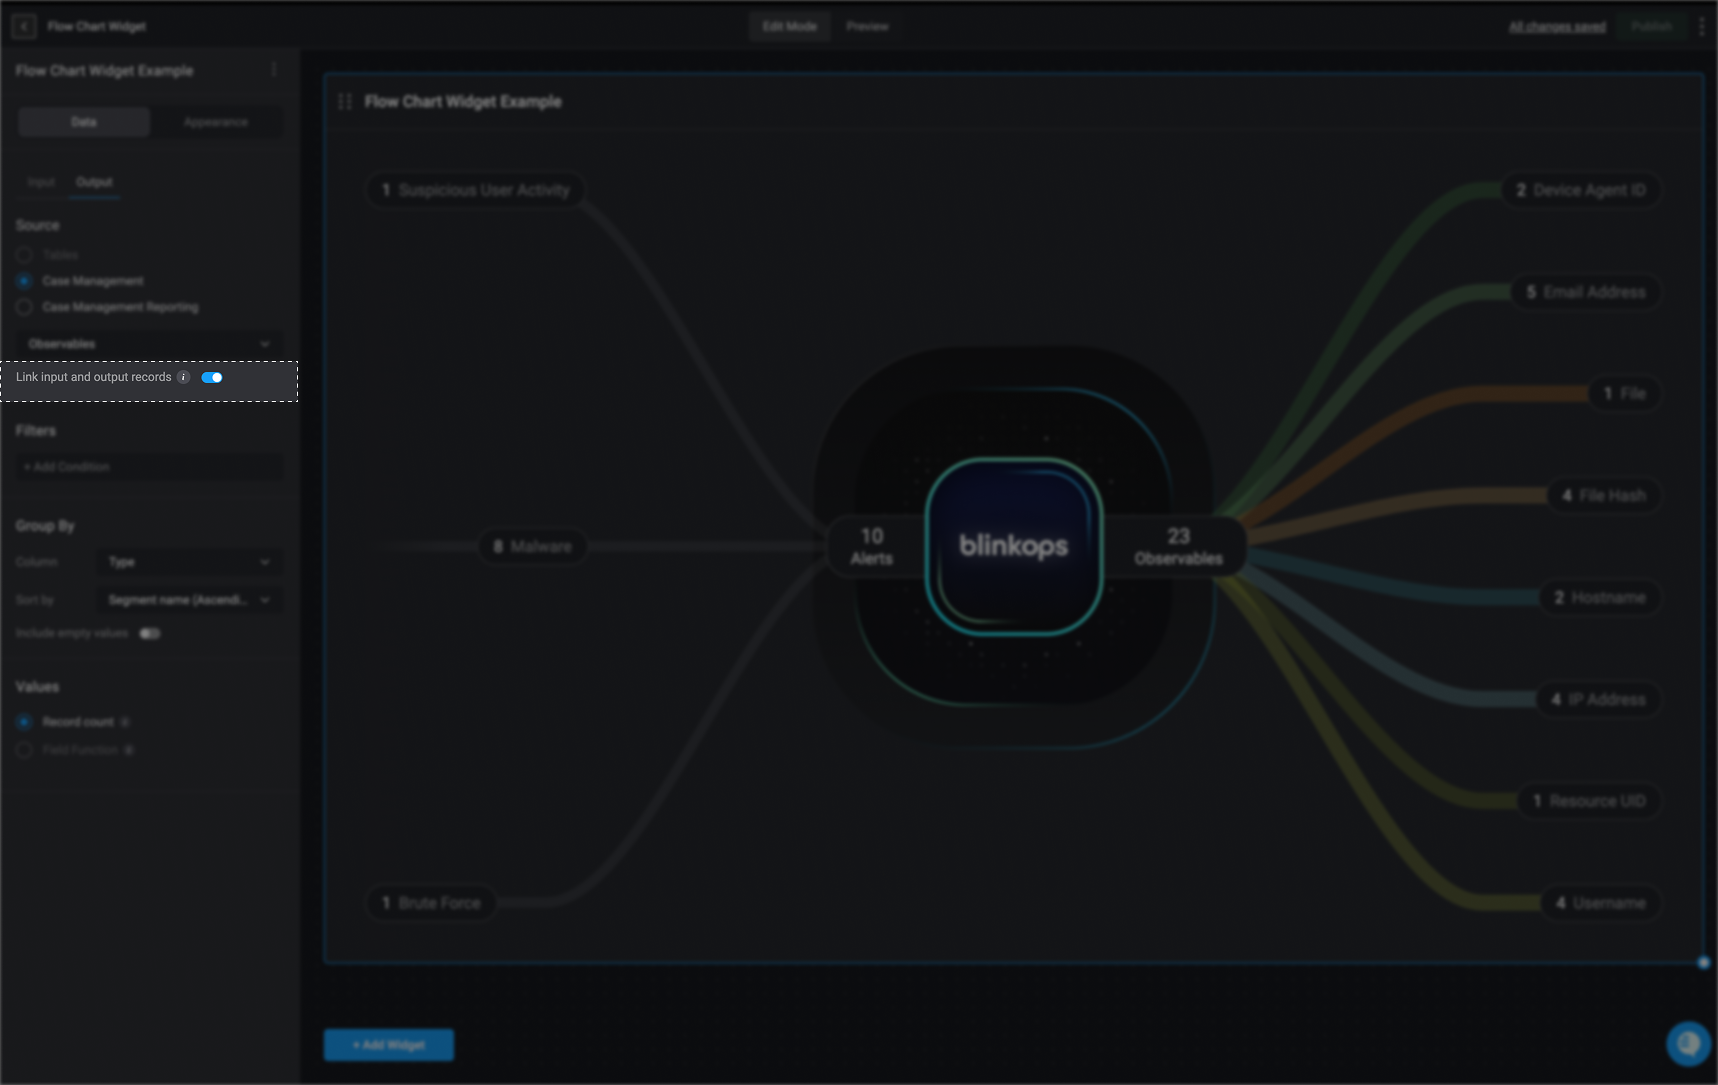
        <Step title="Link Input and Output Settings" stepNumber="3.2">
          When this option is selected, the flow chart will display any records that are linked between the chosen input [data source](/docs/blink-platform/dashboards/building-a-dashboard/source-types/source-types) and output [data source](/docs/blink-platform/dashboards/building-a-dashboard/source-types/source-types).

          This allows you to visualize relationships between related records and better understand how data flows from the source to the destination.

          <Frame>
            <img src="https://mintcdn.com/blinkops-2/DXjtFGP8DMtoAw3E/img/Dashboards/LinkRecords.png?fit=max&auto=format&n=DXjtFGP8DMtoAw3E&q=85&s=0416eee677bf25e36fa1f2f2f104d9a4" width="1718" height="1085" data-path="img/Dashboards/LinkRecords.png" />
          </Frame>

          <Warning>
            **Please be advised**:

            * This setting is only supported for [Tables](/docs/blink-platform/tables/tables) and [Case Management Tables](/docs/case-management/manage-tables) data sources. It cannot be used with the [Case Management Reportings](/docs/blink-platform/dashboards/building-a-dashboard/source-types/case-management-reporting) data source.

            * This setting can only be used if the input and output data sources are of the same type. It cannot be applied when the input and output use different data sources.
          </Warning>
        </Step>
      </Tab>
    </Tabs>
  </Step>

  <Step title="Apply Filters to the Input or Output of the Flow Chart Widget (Optional)">
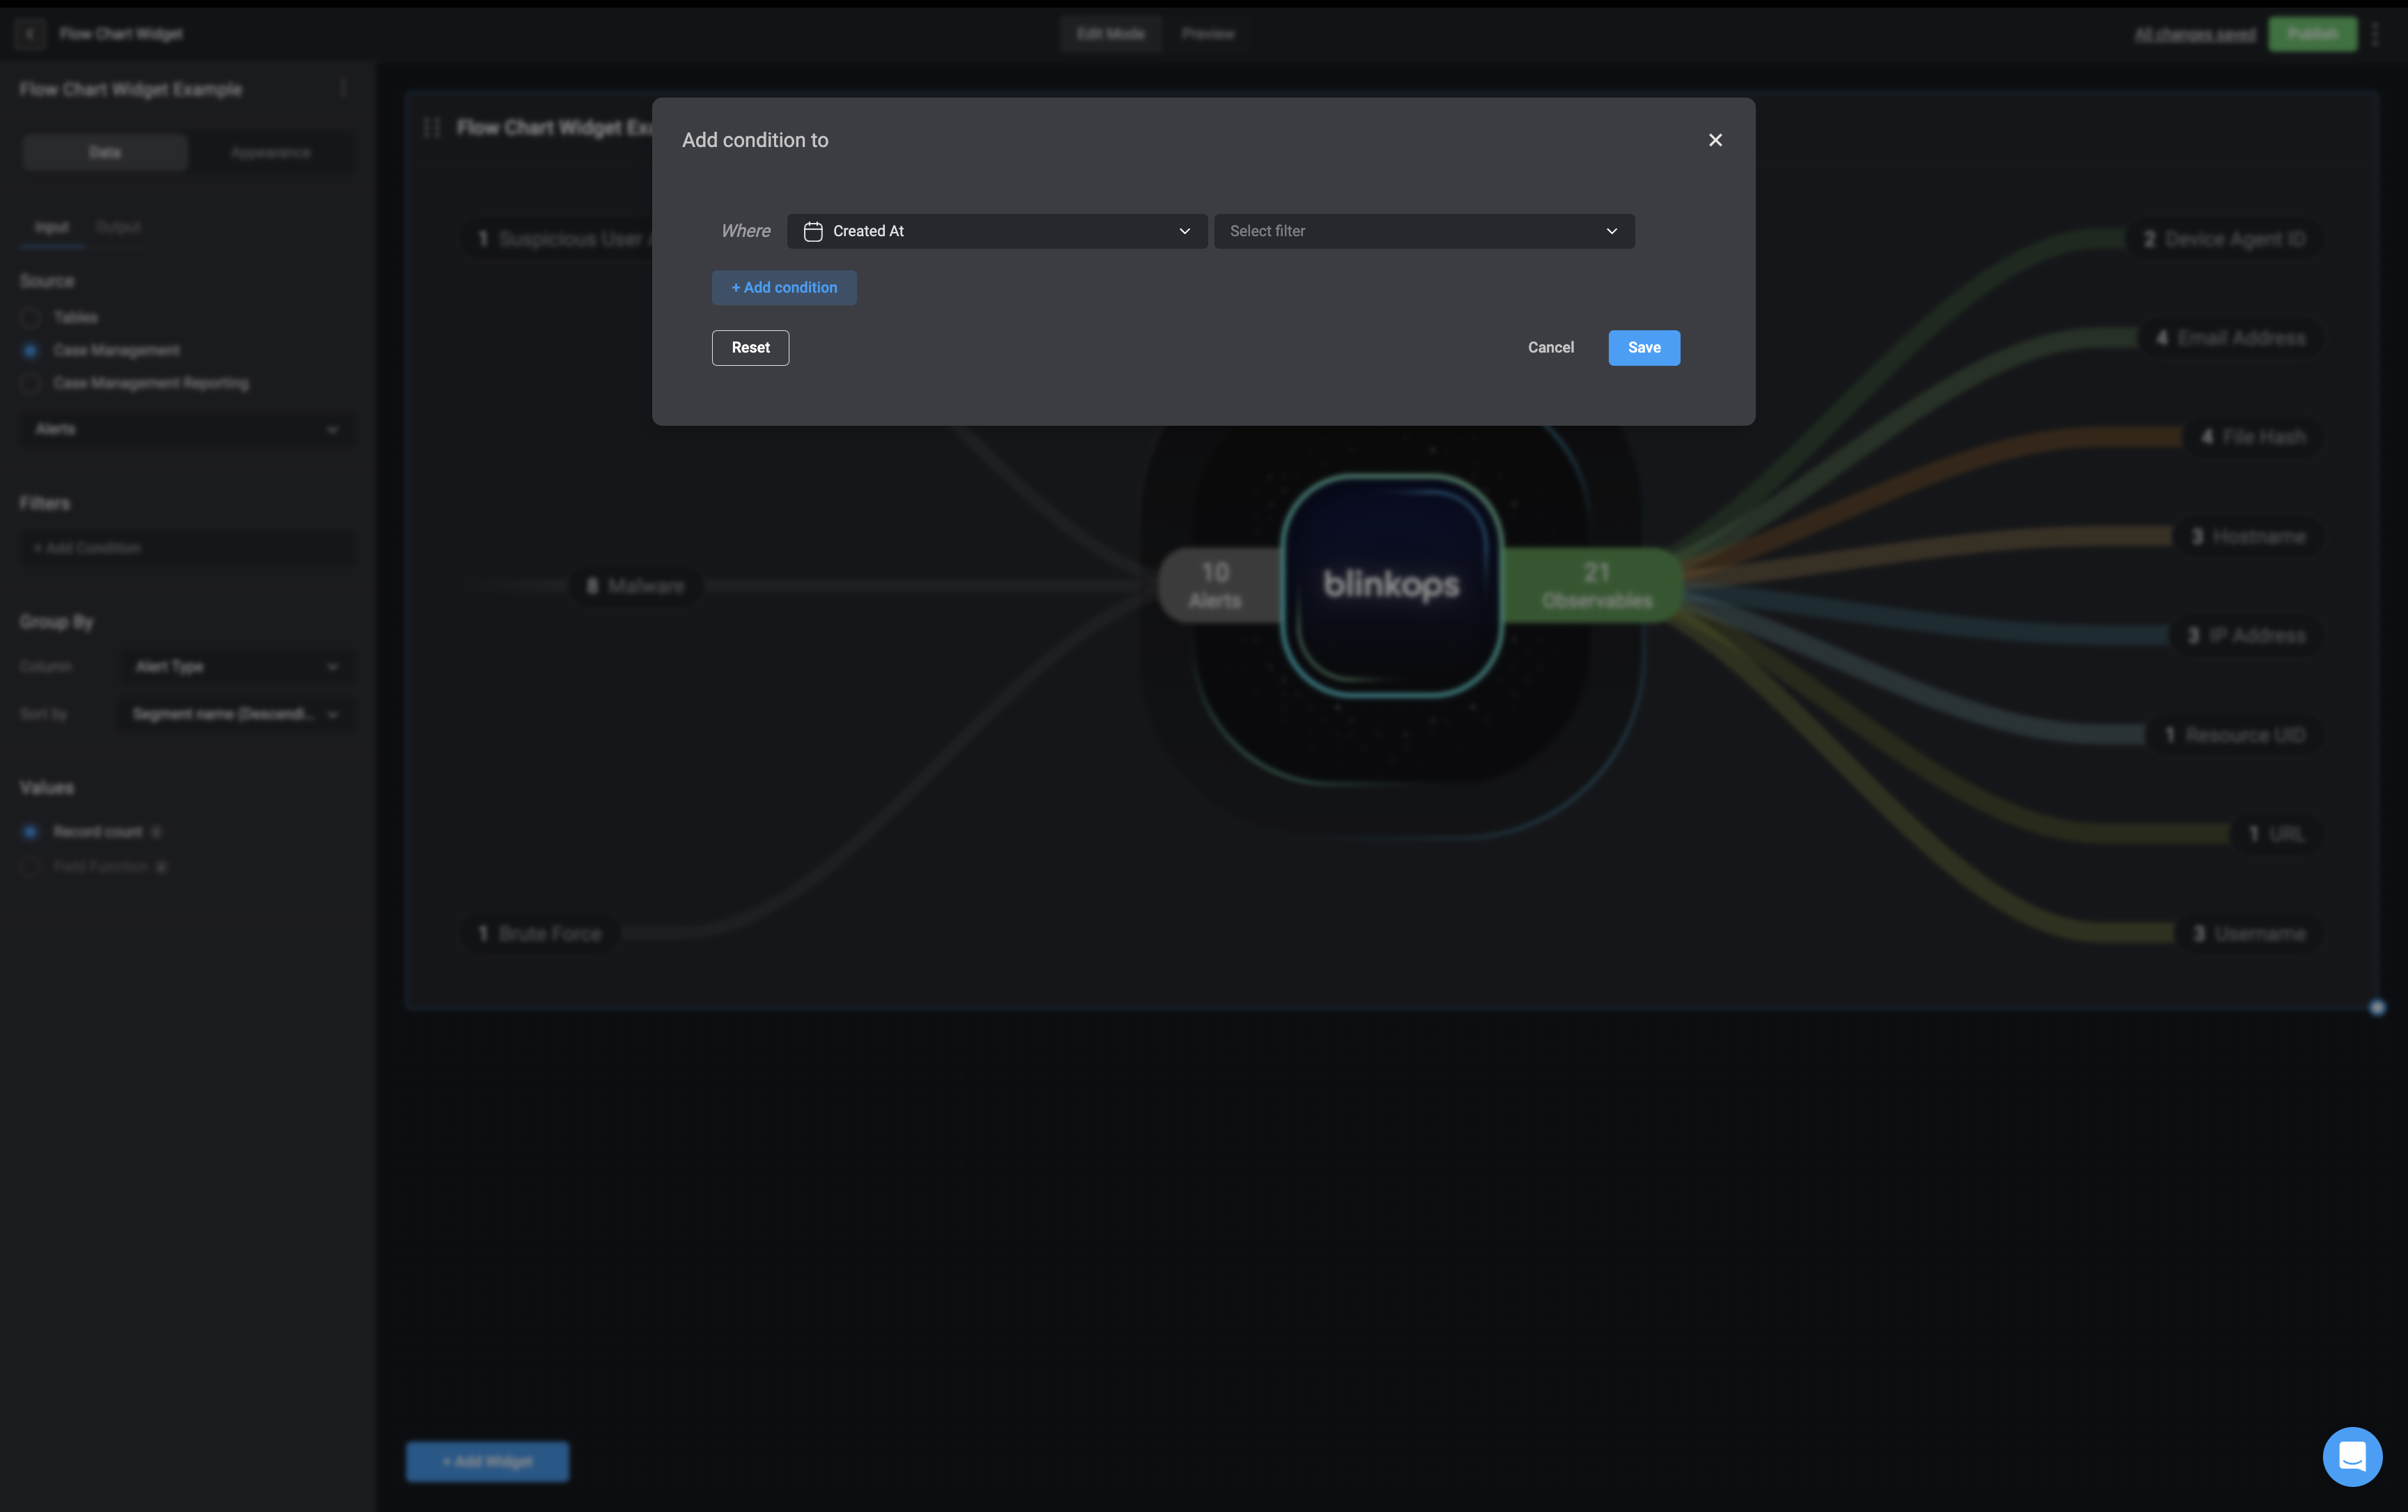
    Under the Filters section, you can use the [condition builder](/docs/workflows/building-workflows/condition-builder#condition-builder) to define one or more conditions that determine which records are included, filtering the underlying data accordingly. You can also create [nested conditions](/docs/blink-platform/condition-builder/condition-builder#the-advanced-condition-builder-and-nested-conditions) to group related conditions together and apply their own `AND` or `OR` logic, enabling more advanced and precise filtering.

    <Frame>
      <img src="https://mintcdn.com/blinkops-2/sNRSsm2uF-0J6IVJ/img/Dashboards/FlowChartFilters.png?fit=max&auto=format&n=sNRSsm2uF-0J6IVJ&q=85&s=f5dfb038ab7ada5f1cfd6da70e78bd62" width="3456" height="2170" data-path="img/Dashboards/FlowChartFilters.png" />
    </Frame>
  </Step>

  <Step title="Configure Number Display">
    Under the *Numbers* section:

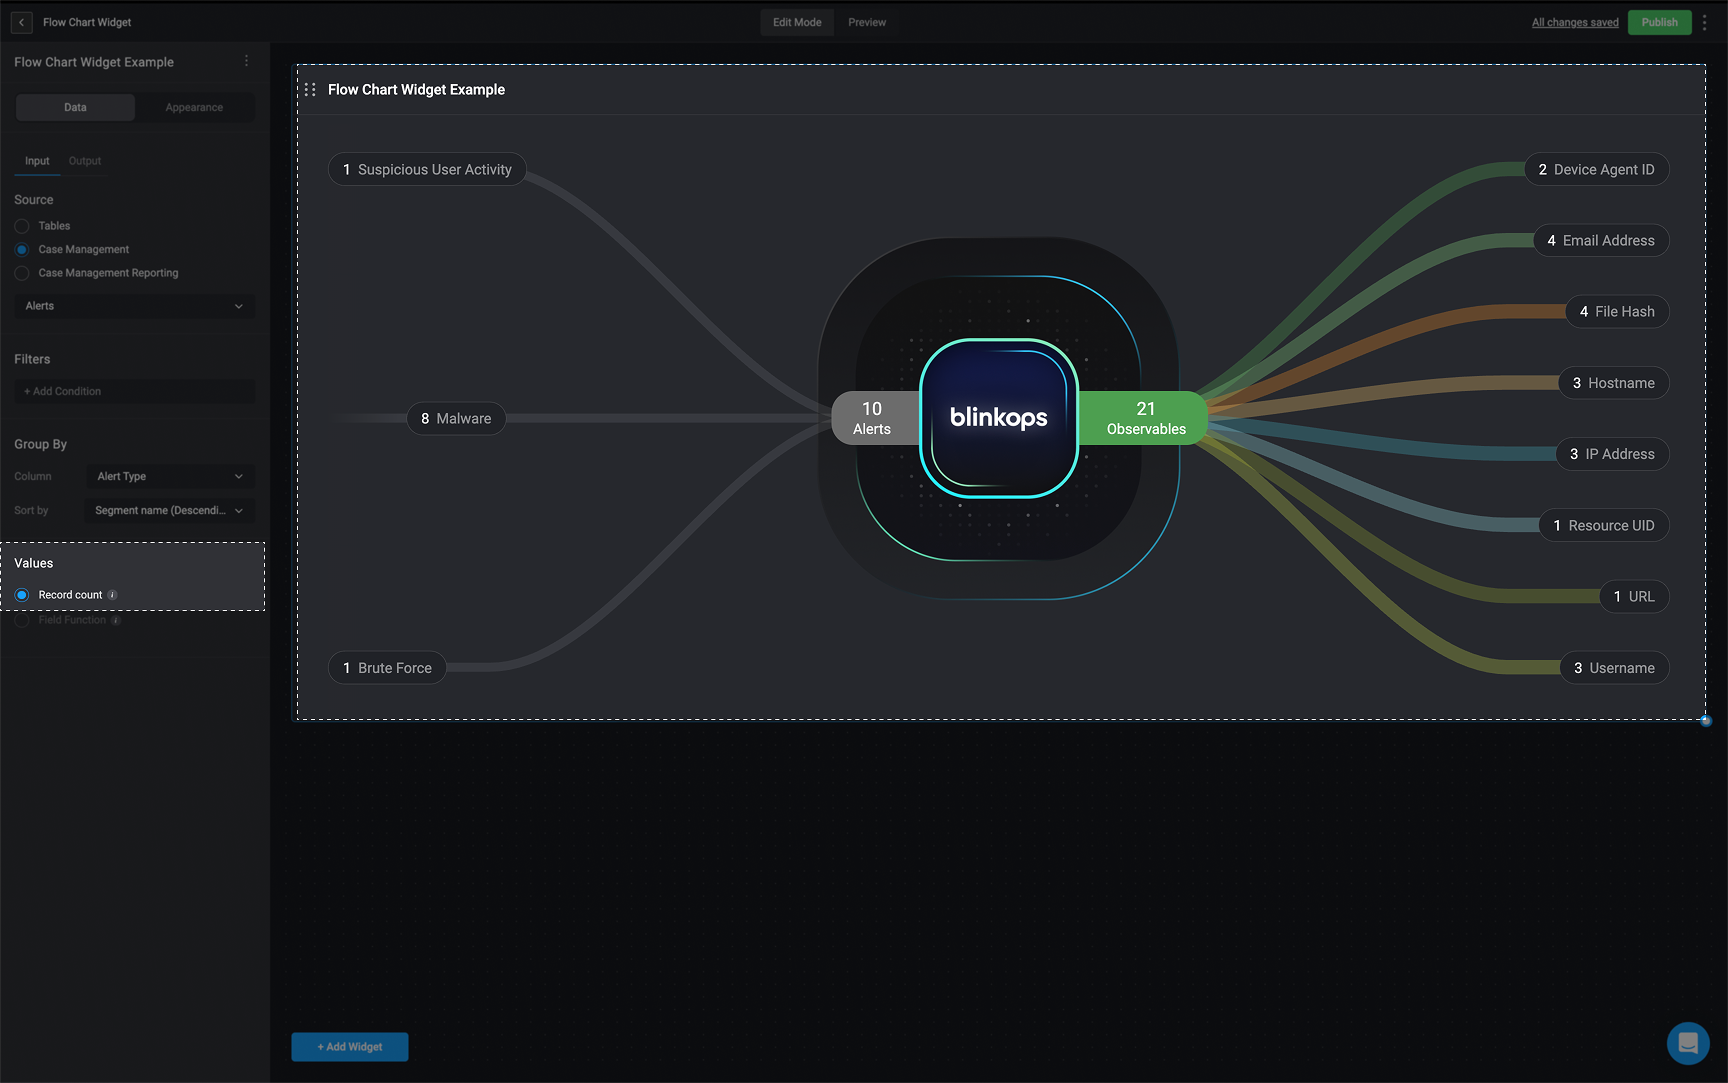
    1. If you select **Record Count**: It will display the number of records available on the selected source table on the Flow Chart widget.

           <Frame>
             <img src="https://mintcdn.com/blinkops-2/sNRSsm2uF-0J6IVJ/img/Dashboards/FlowChartRecordCount.png?fit=max&auto=format&n=sNRSsm2uF-0J6IVJ&q=85&s=53eec2d39e0ff37c214e87c3e2f618f4" width="1728" height="1083" data-path="img/Dashboards/FlowChartRecordCount.png" />
           </Frame>

    **OR**

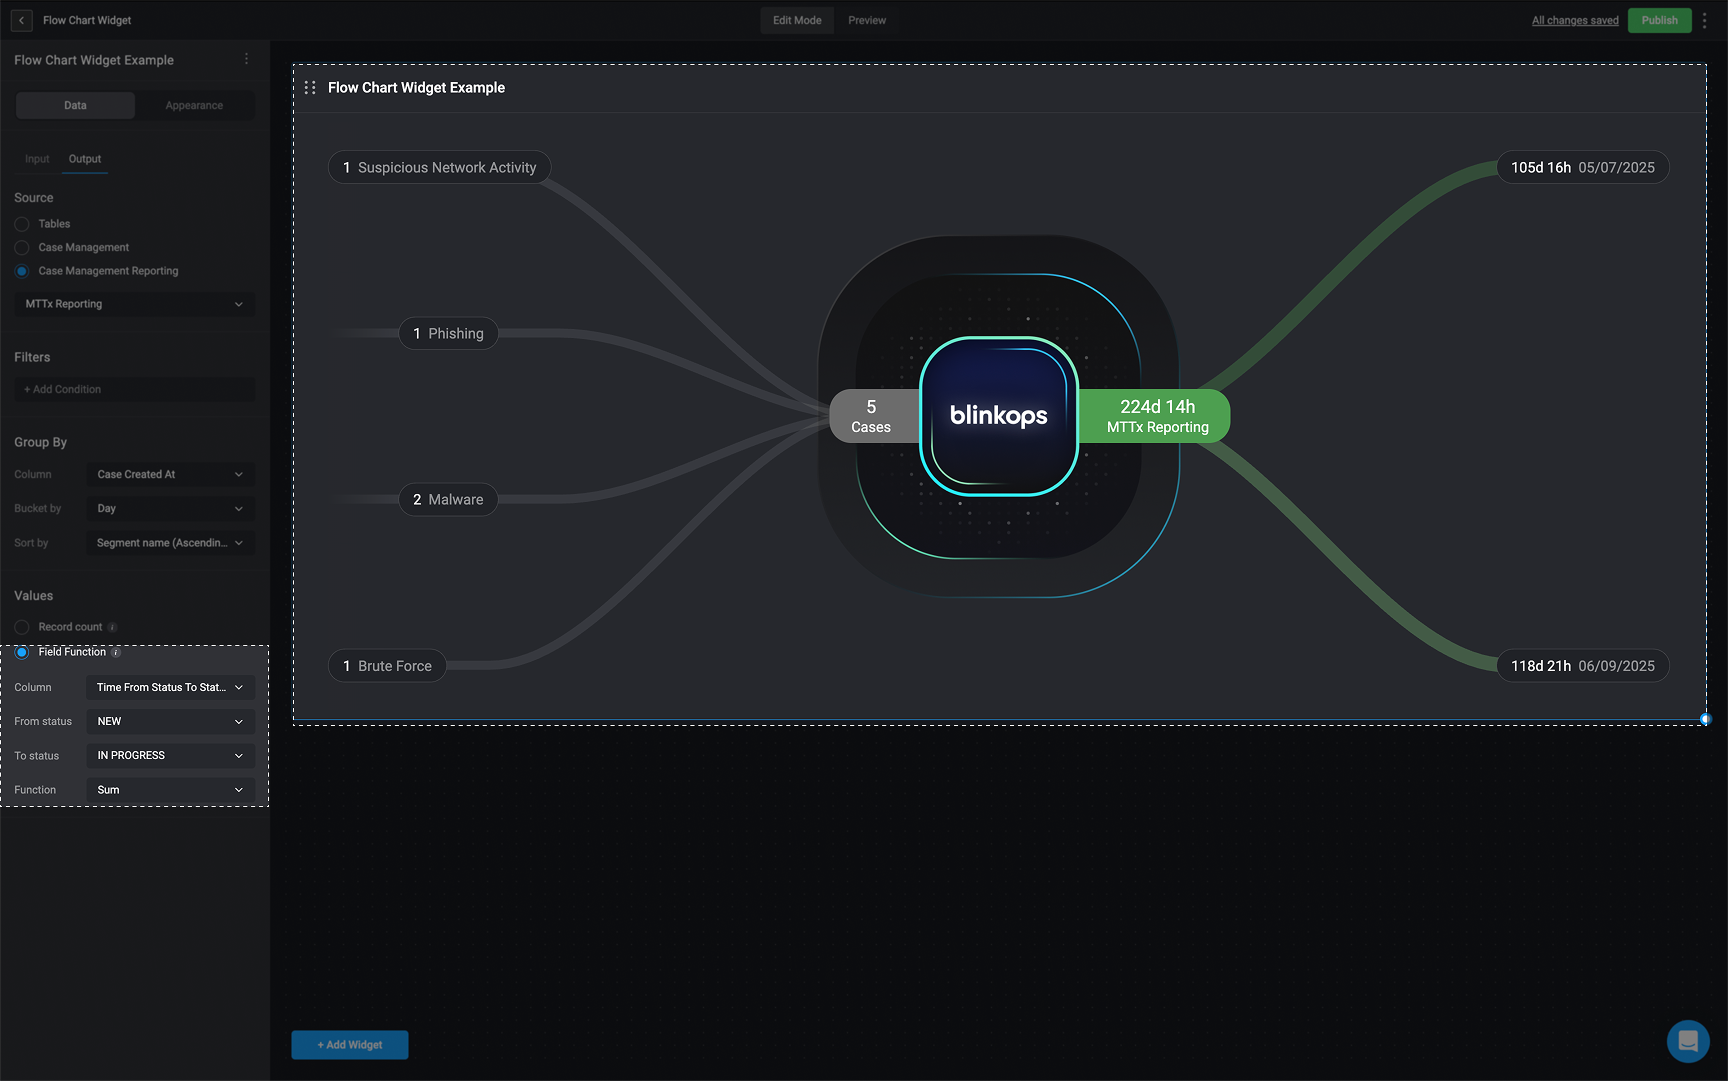
    2. If you select **Field Function** (You can only add a **Field Function** if the selected column is a **numeric value**).

       1. **Choose a column**: `Time from Case Open to Status`,`Time from Status to Status`, `Time in Status`, `Time to Close`, `Time to Assign`
       2. **Choose the sum operation that will be used to calculate the selected column values**: `Sum`, `Maximum`, `Minimum`, `Average` or `Median`.
           <Frame>
             <img src="https://mintcdn.com/blinkops-2/sNRSsm2uF-0J6IVJ/img/Dashboards/FlowChartFieldFunction.png?fit=max&auto=format&n=sNRSsm2uF-0J6IVJ&q=85&s=b645a85fe6073f86927713b96ceecfda" width="1728" height="1081" data-path="img/Dashboards/FlowChartFieldFunction.png" />
           </Frame>
  </Step>
</Steps>

***

## Customize the Flow Chart Widget

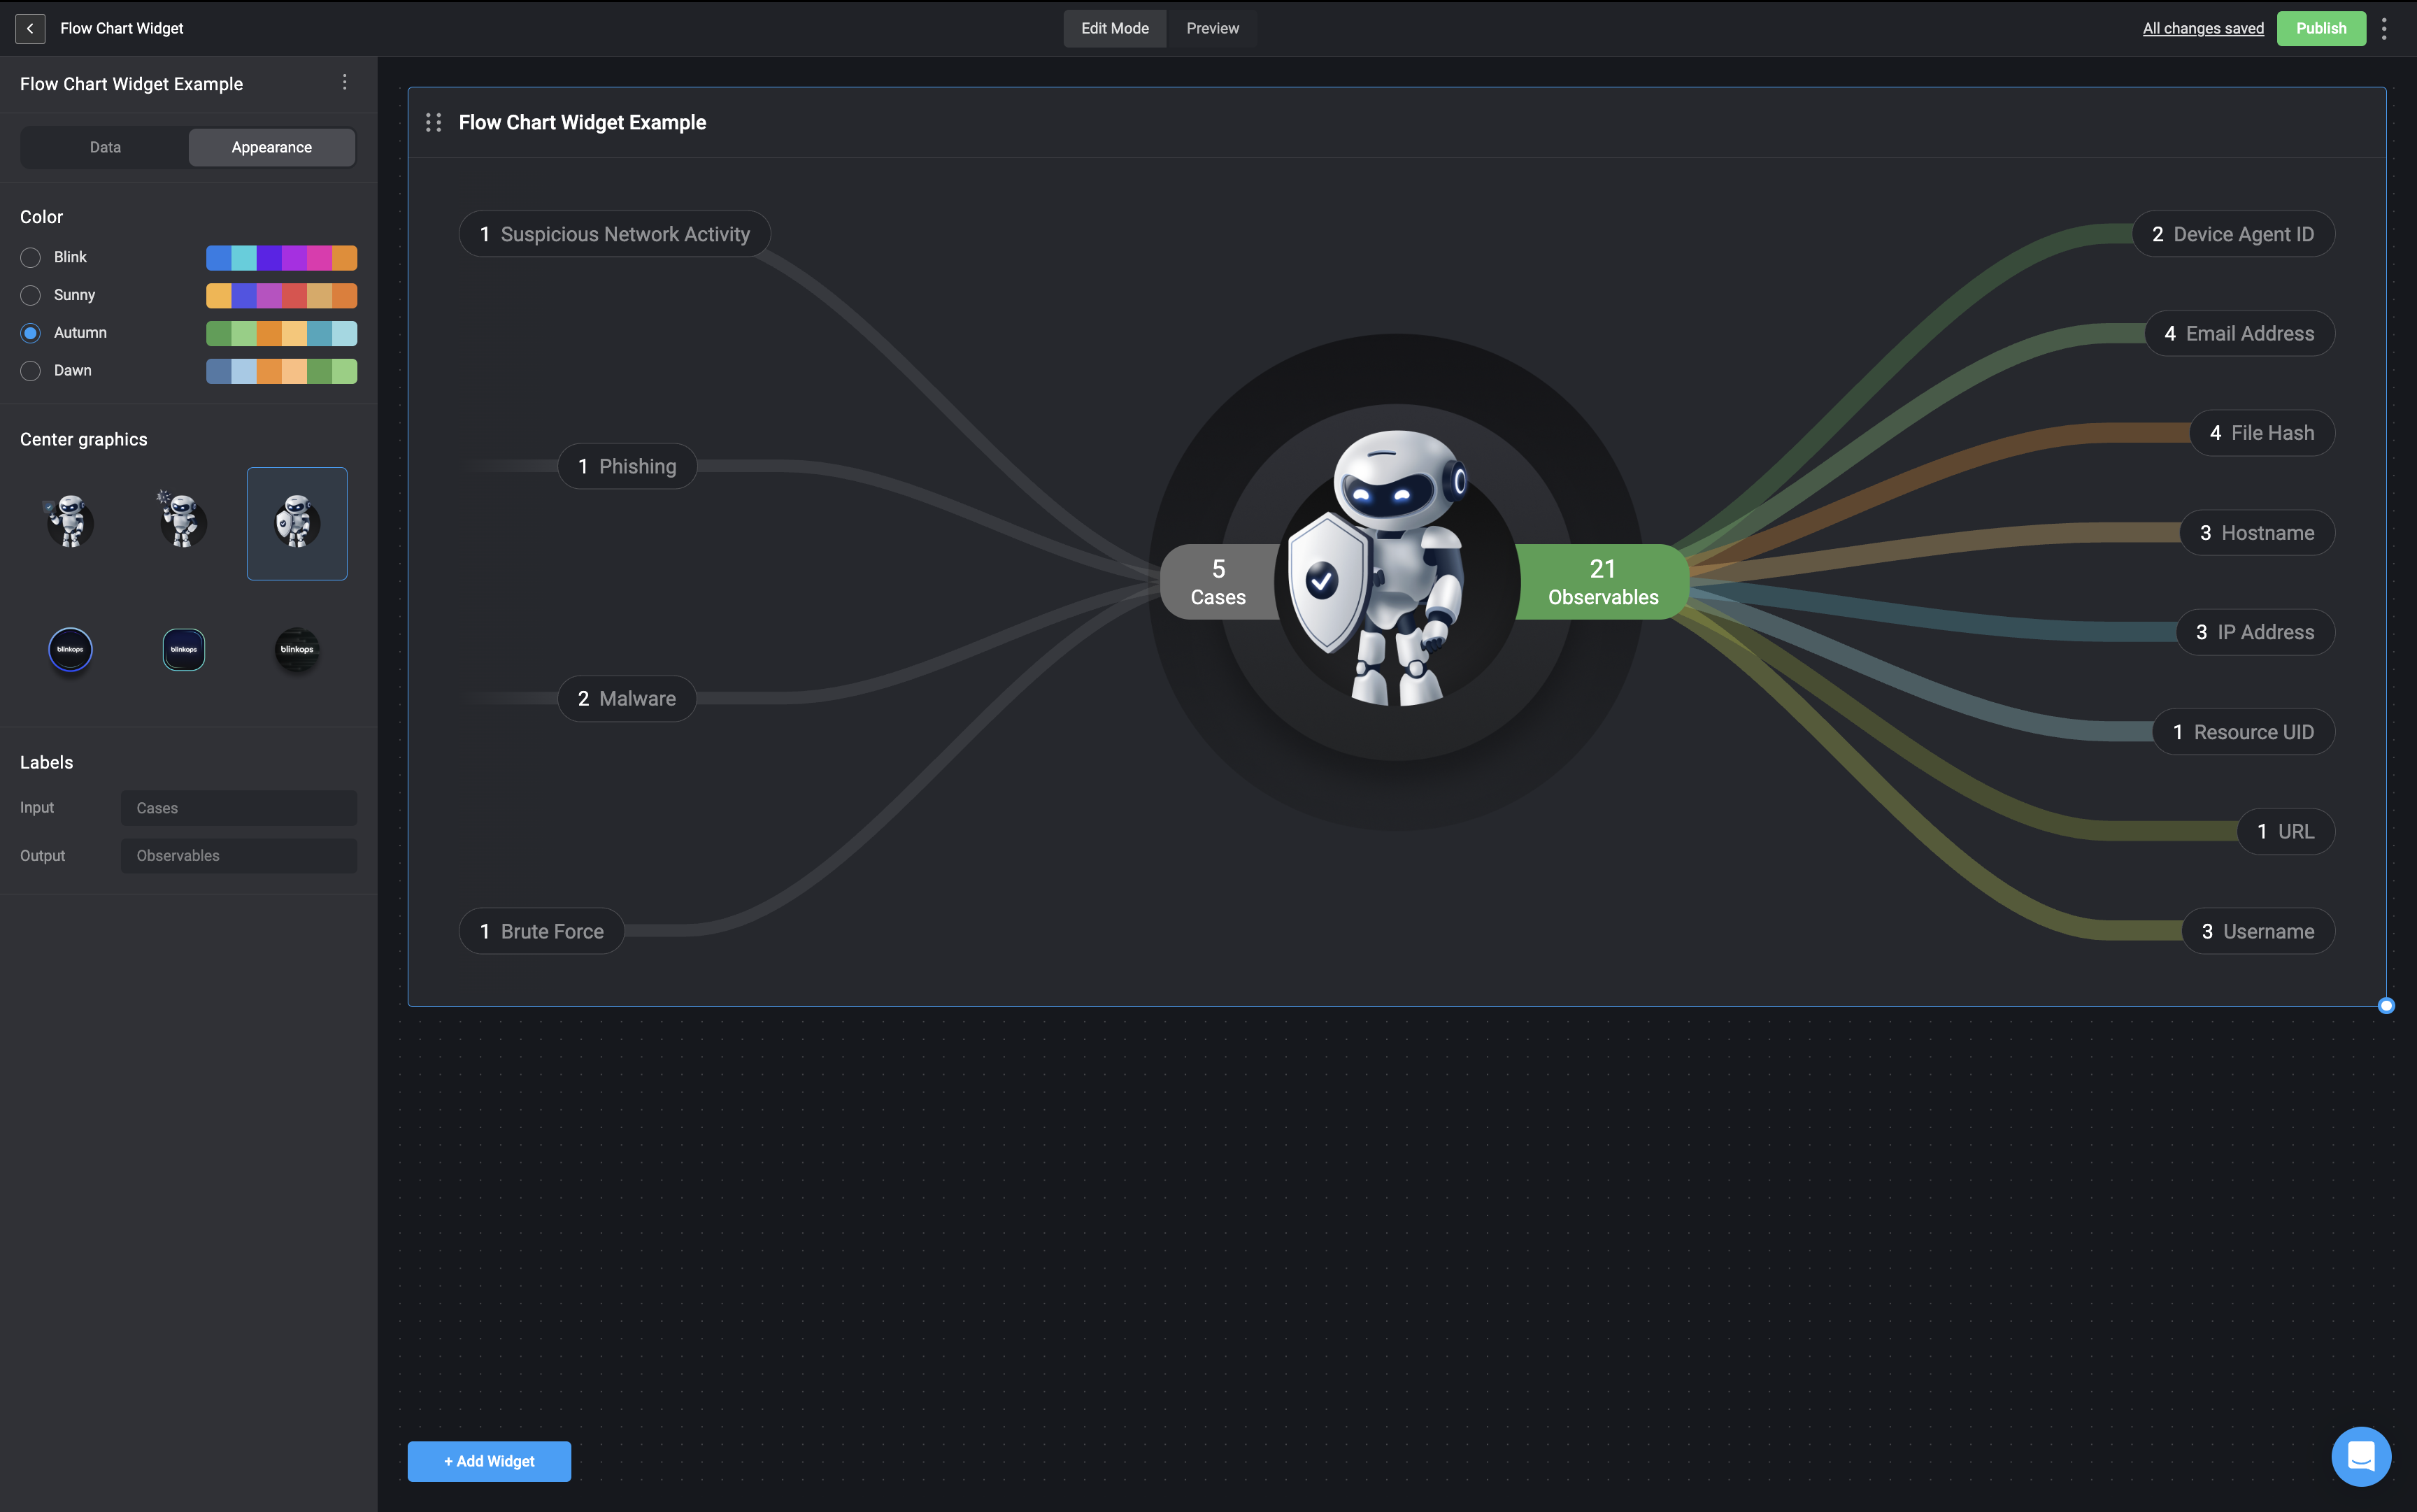
In the **Appearance** tab, you can fully customize the **Flow Chart Widget** to match your dashboard’s style and needs. You have control over the color theme, central graphic, and labels for inputs and outputs:

1. **Select a color theme** – Pick a color palette that fits your dashboard’s look.
2. **Choose a central graphic** – Select the image or icon to display at the center of the widget.
3. **Set labels** – Define labels for the inputs and outputs to clarify the flow of information.

<Frame>
  <img src="https://mintcdn.com/blinkops-2/JG8fU3ZvfN8rpRf-/img/Dashboards/CustomizeFlowChartWidget.png?fit=max&auto=format&n=JG8fU3ZvfN8rpRf-&q=85&s=c78588b0a16f5caa04e0b1608893c588" width="3456" height="2162" data-path="img/Dashboards/CustomizeFlowChartWidget.png" />
</Frame>

***

## Editing a Flow Chart Widget

In the **Data** tab, any changes you make will be automatically applied to the Flow Chart widget in real time.

***

## Deleting a Flow Chart Widget
<Steps>
  <Step title="Select Delete Button">
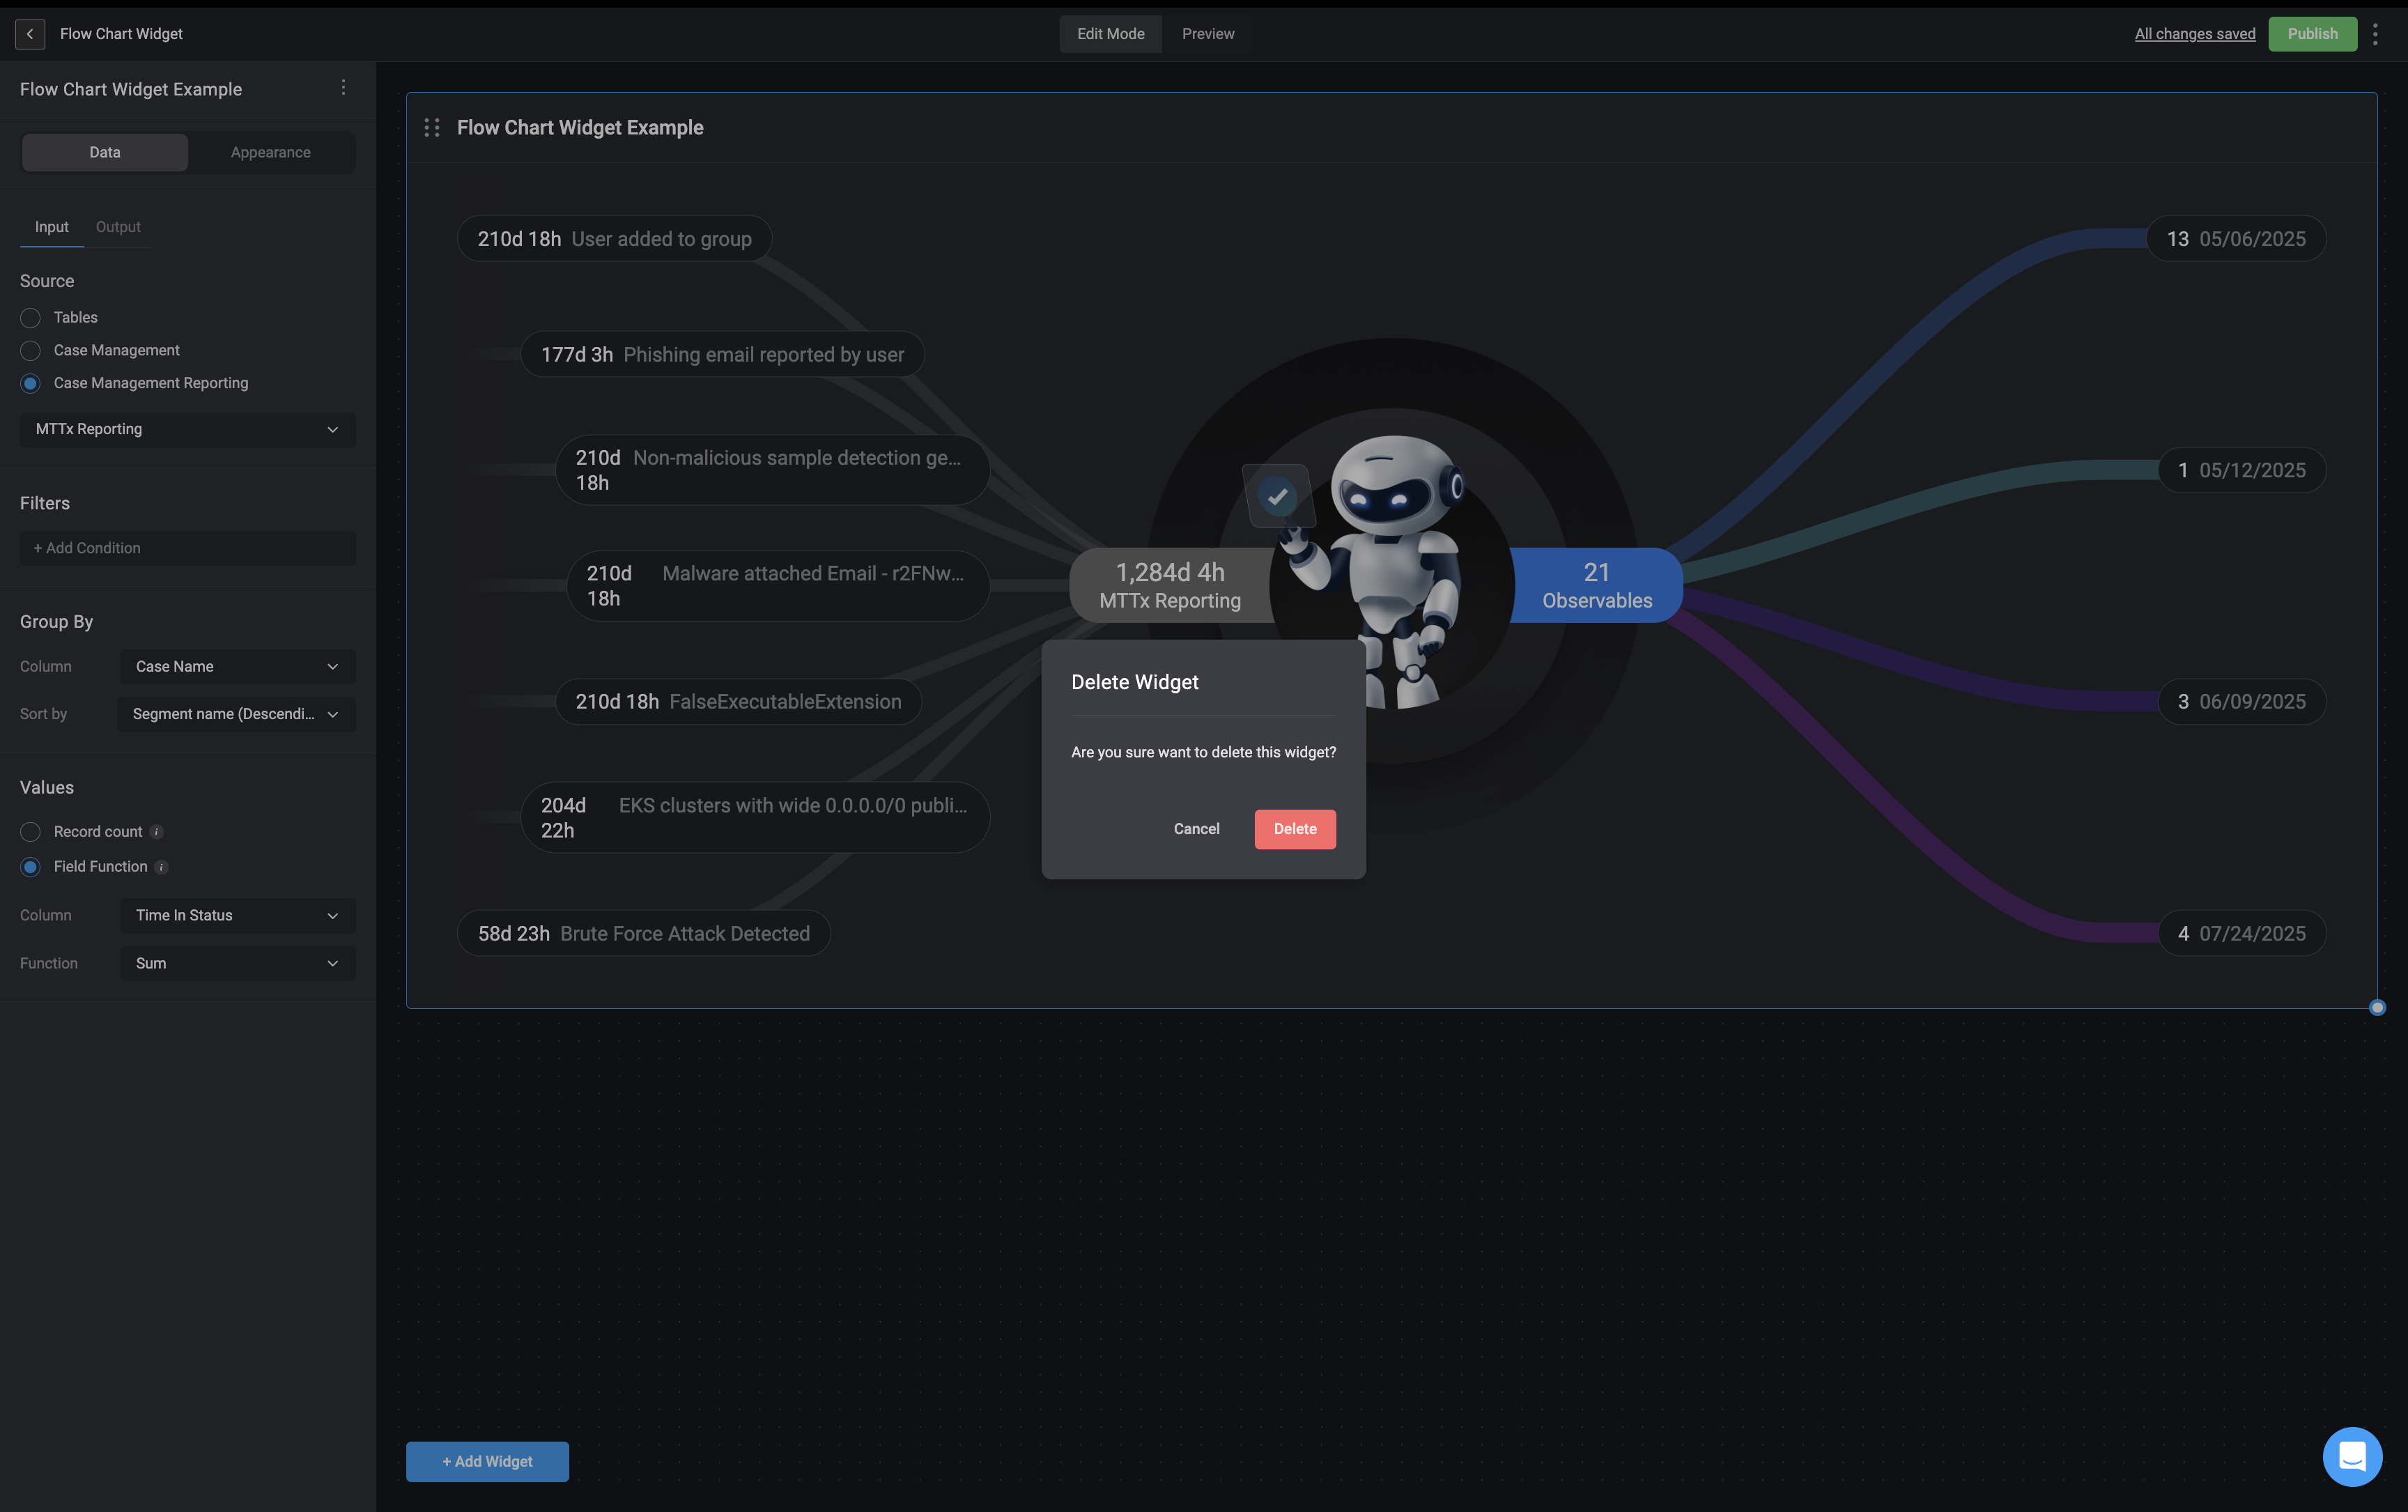
    <p>In the left-hand sidebar, click the <Icon icon="square-ellipsis-vertical" iconType="solid" /> icon in the top-right corner and then select the delete button.</p>
  </Step>

  <Step title="Confirm Widget Removal">
    The Flow Chart widget will be removed from your Dashboard Building Interface.

    <Frame>
      <img src="https://mintcdn.com/blinkops-2/zP20L2GmeUpAlIhx/img/Dashboards/DeleteFlowChart.png?fit=max&auto=format&n=zP20L2GmeUpAlIhx&q=85&s=b5e92dda8b6e6d1bd65516199b83e252" width="3456" height="2170" data-path="img/Dashboards/DeleteFlowChart.png" />
    </Frame>
  </Step>
</Steps>
