> ## Documentation Index
> Fetch the complete documentation index at: https://docs.blinkops.com/llms.txt
> Use this file to discover all available pages before exploring further.
# Dashboard Building Interface
> Step-by-step guide to building dashboards with widgets, filters, and data sources in Blink.
## Create your First Dashboard
1. In your selected workspace, go to the 'Dashboards' tab and click 'New Dashboard'.
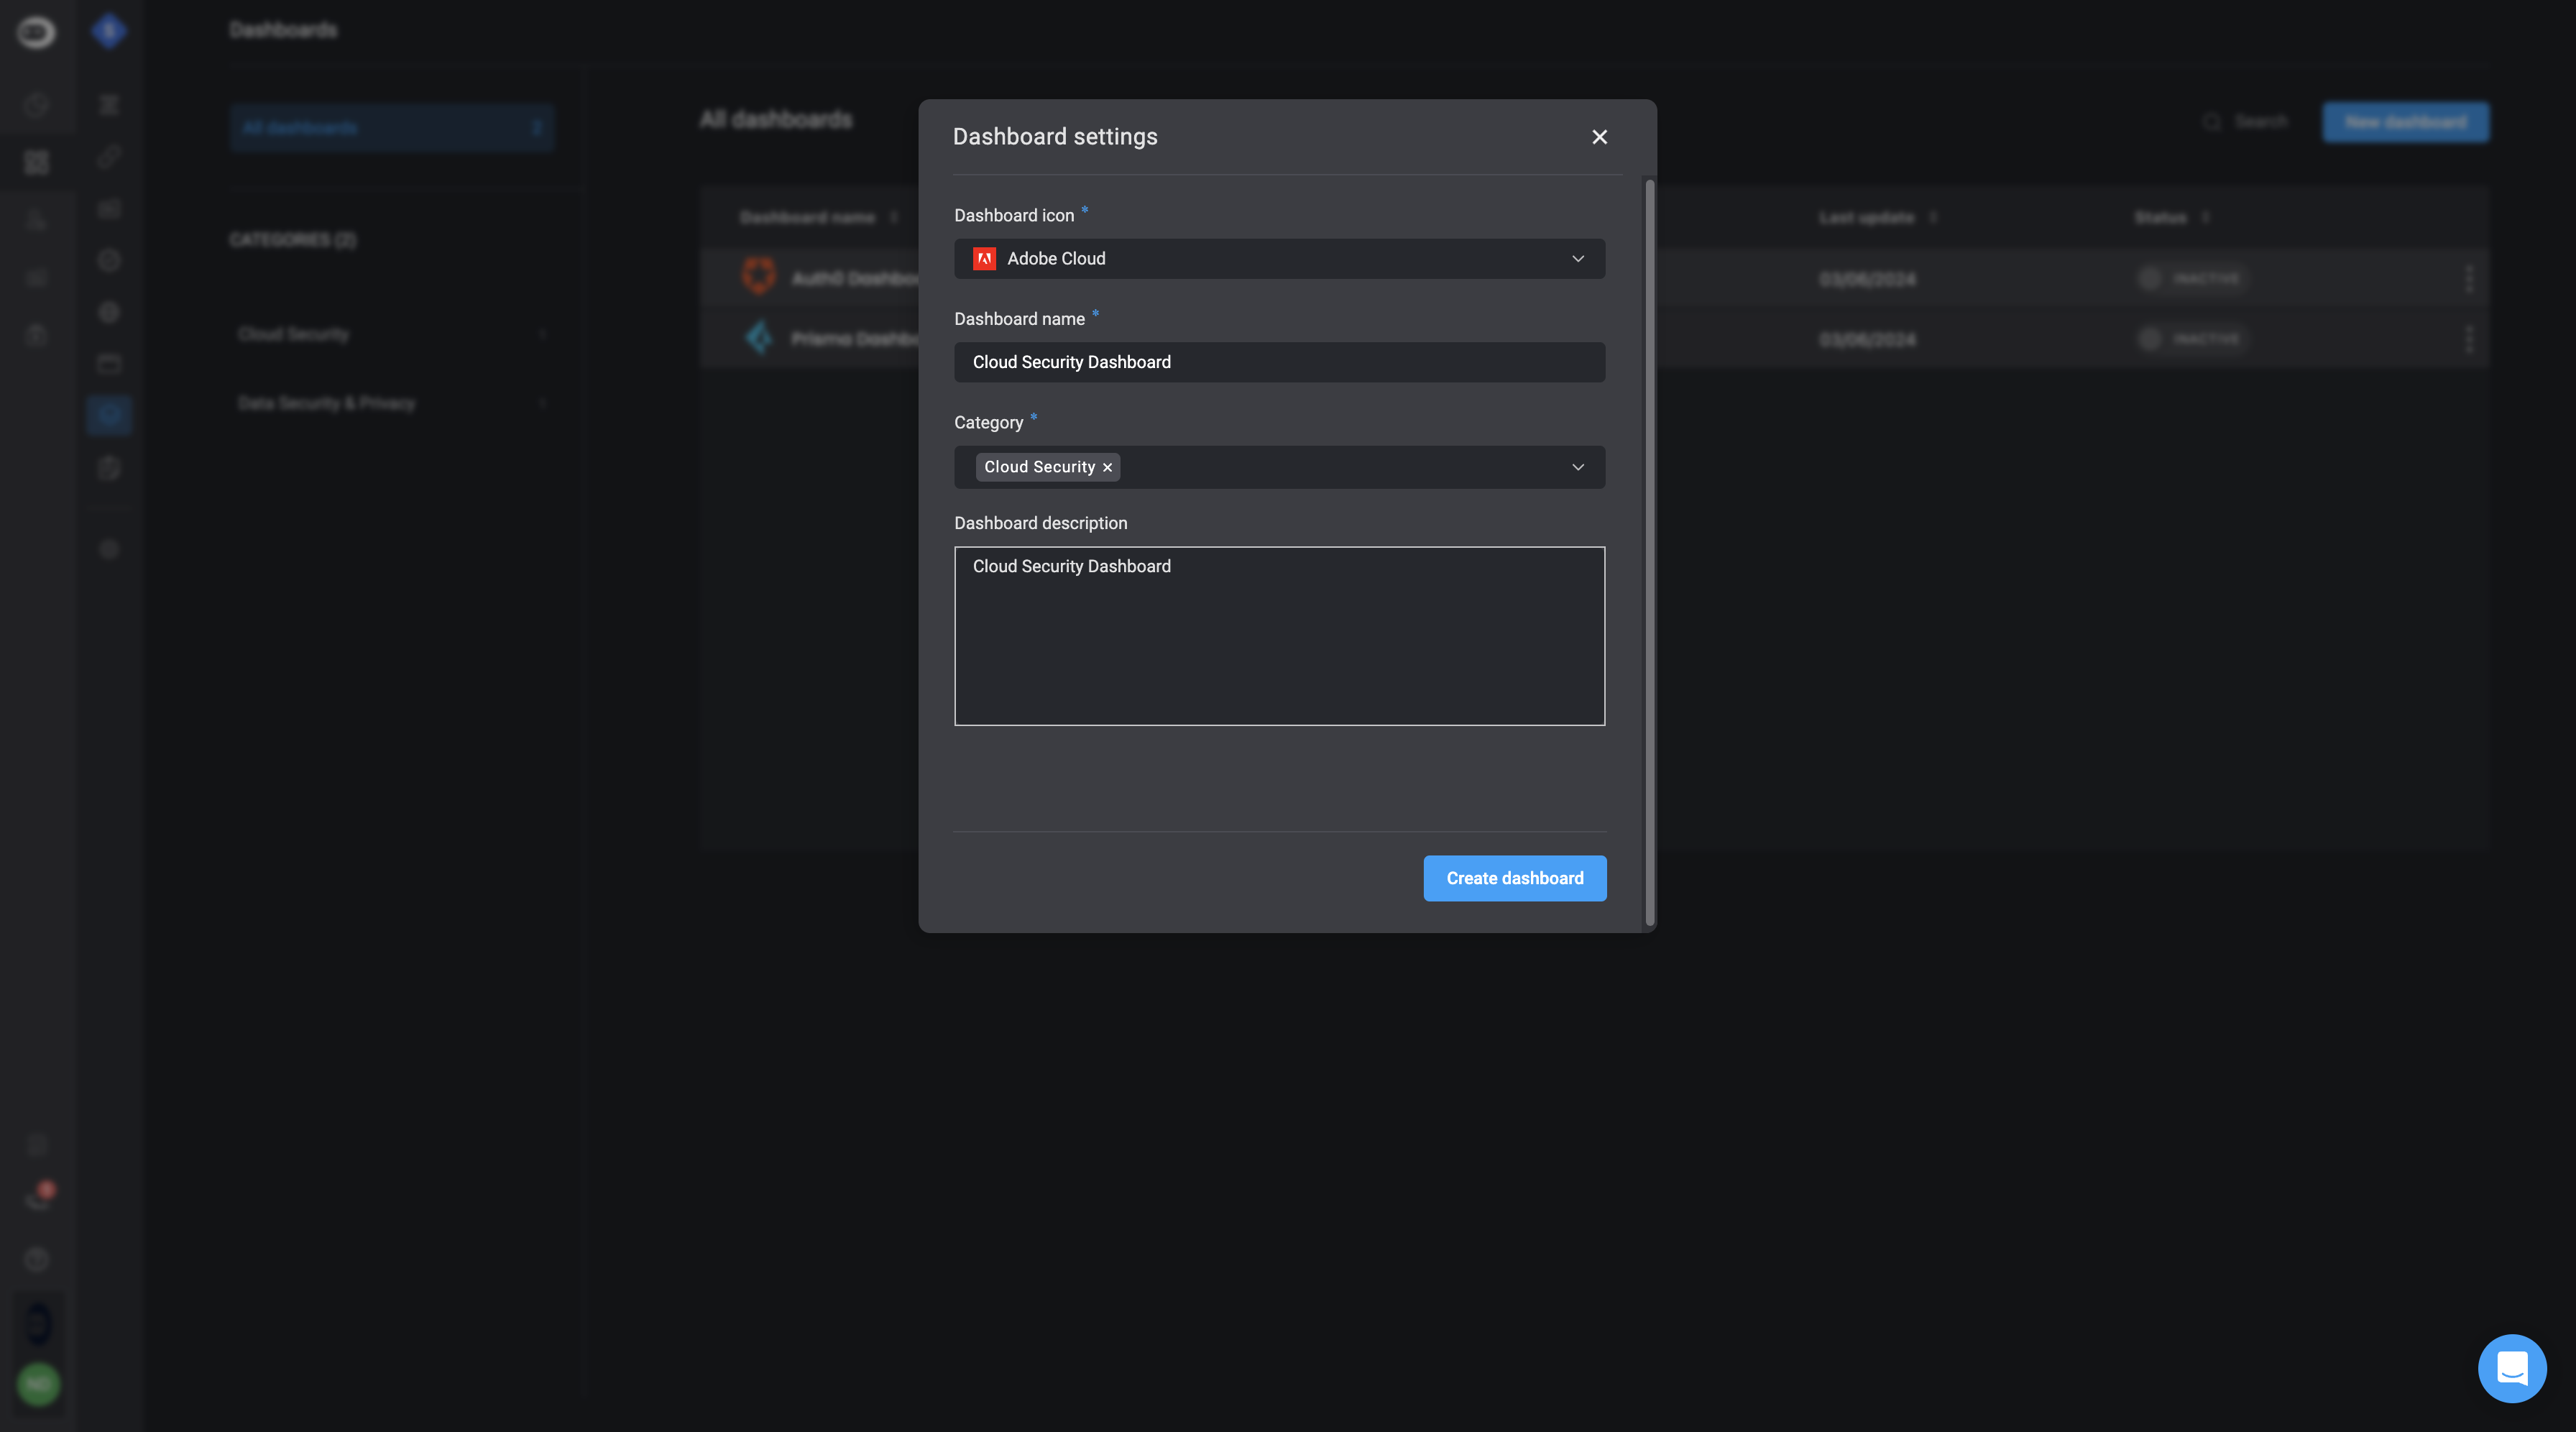
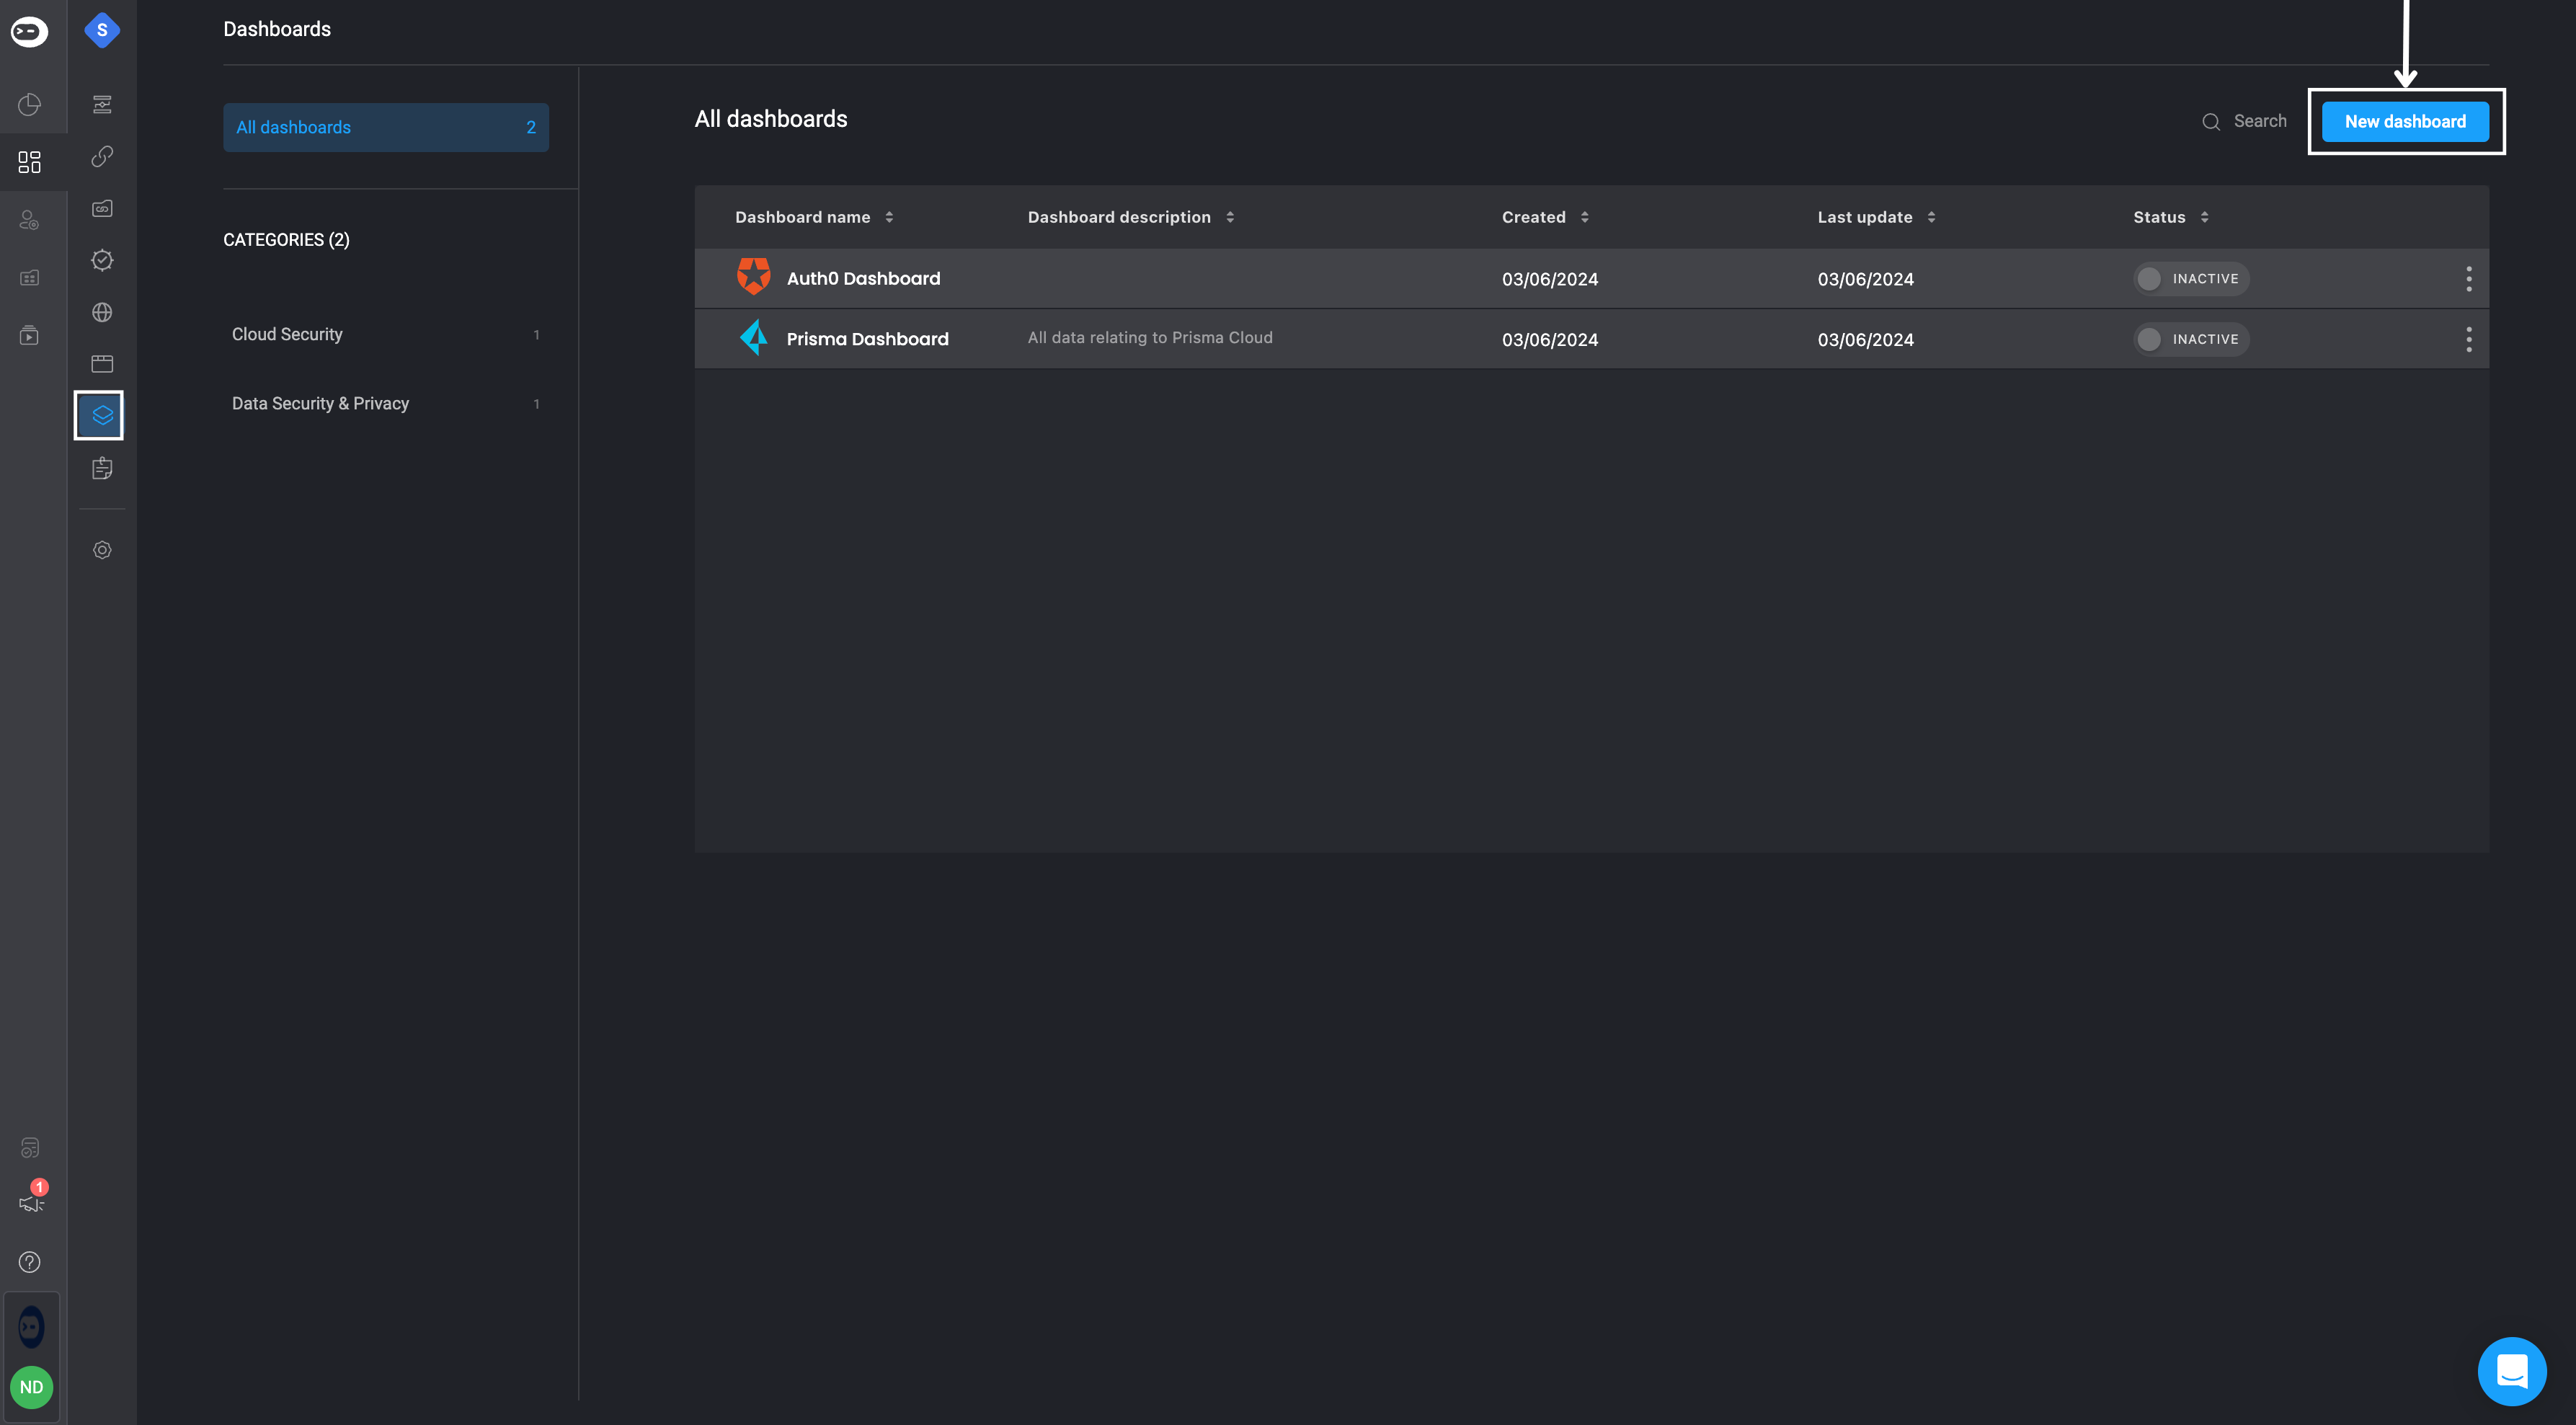 2. Choose an icon to customize your dashboard.
3. Provide a name for your dashboard.
4. Choose one of the following categories:
* **Email Security**
* **Cloud Security**
* **Endpoint Security**
* **Network Security**
* **Data Security and Privacy**
* **Credential Security**
* **Insider Threat**
* **Identity and Access Management**
* **SOC & Incident Response**
* **Threat Intelligence**
5. **Optional**- Provide a short description for your dashboard.
2. Choose an icon to customize your dashboard.
3. Provide a name for your dashboard.
4. Choose one of the following categories:
* **Email Security**
* **Cloud Security**
* **Endpoint Security**
* **Network Security**
* **Data Security and Privacy**
* **Credential Security**
* **Insider Threat**
* **Identity and Access Management**
* **SOC & Incident Response**
* **Threat Intelligence**
5. **Optional**- Provide a short description for your dashboard.
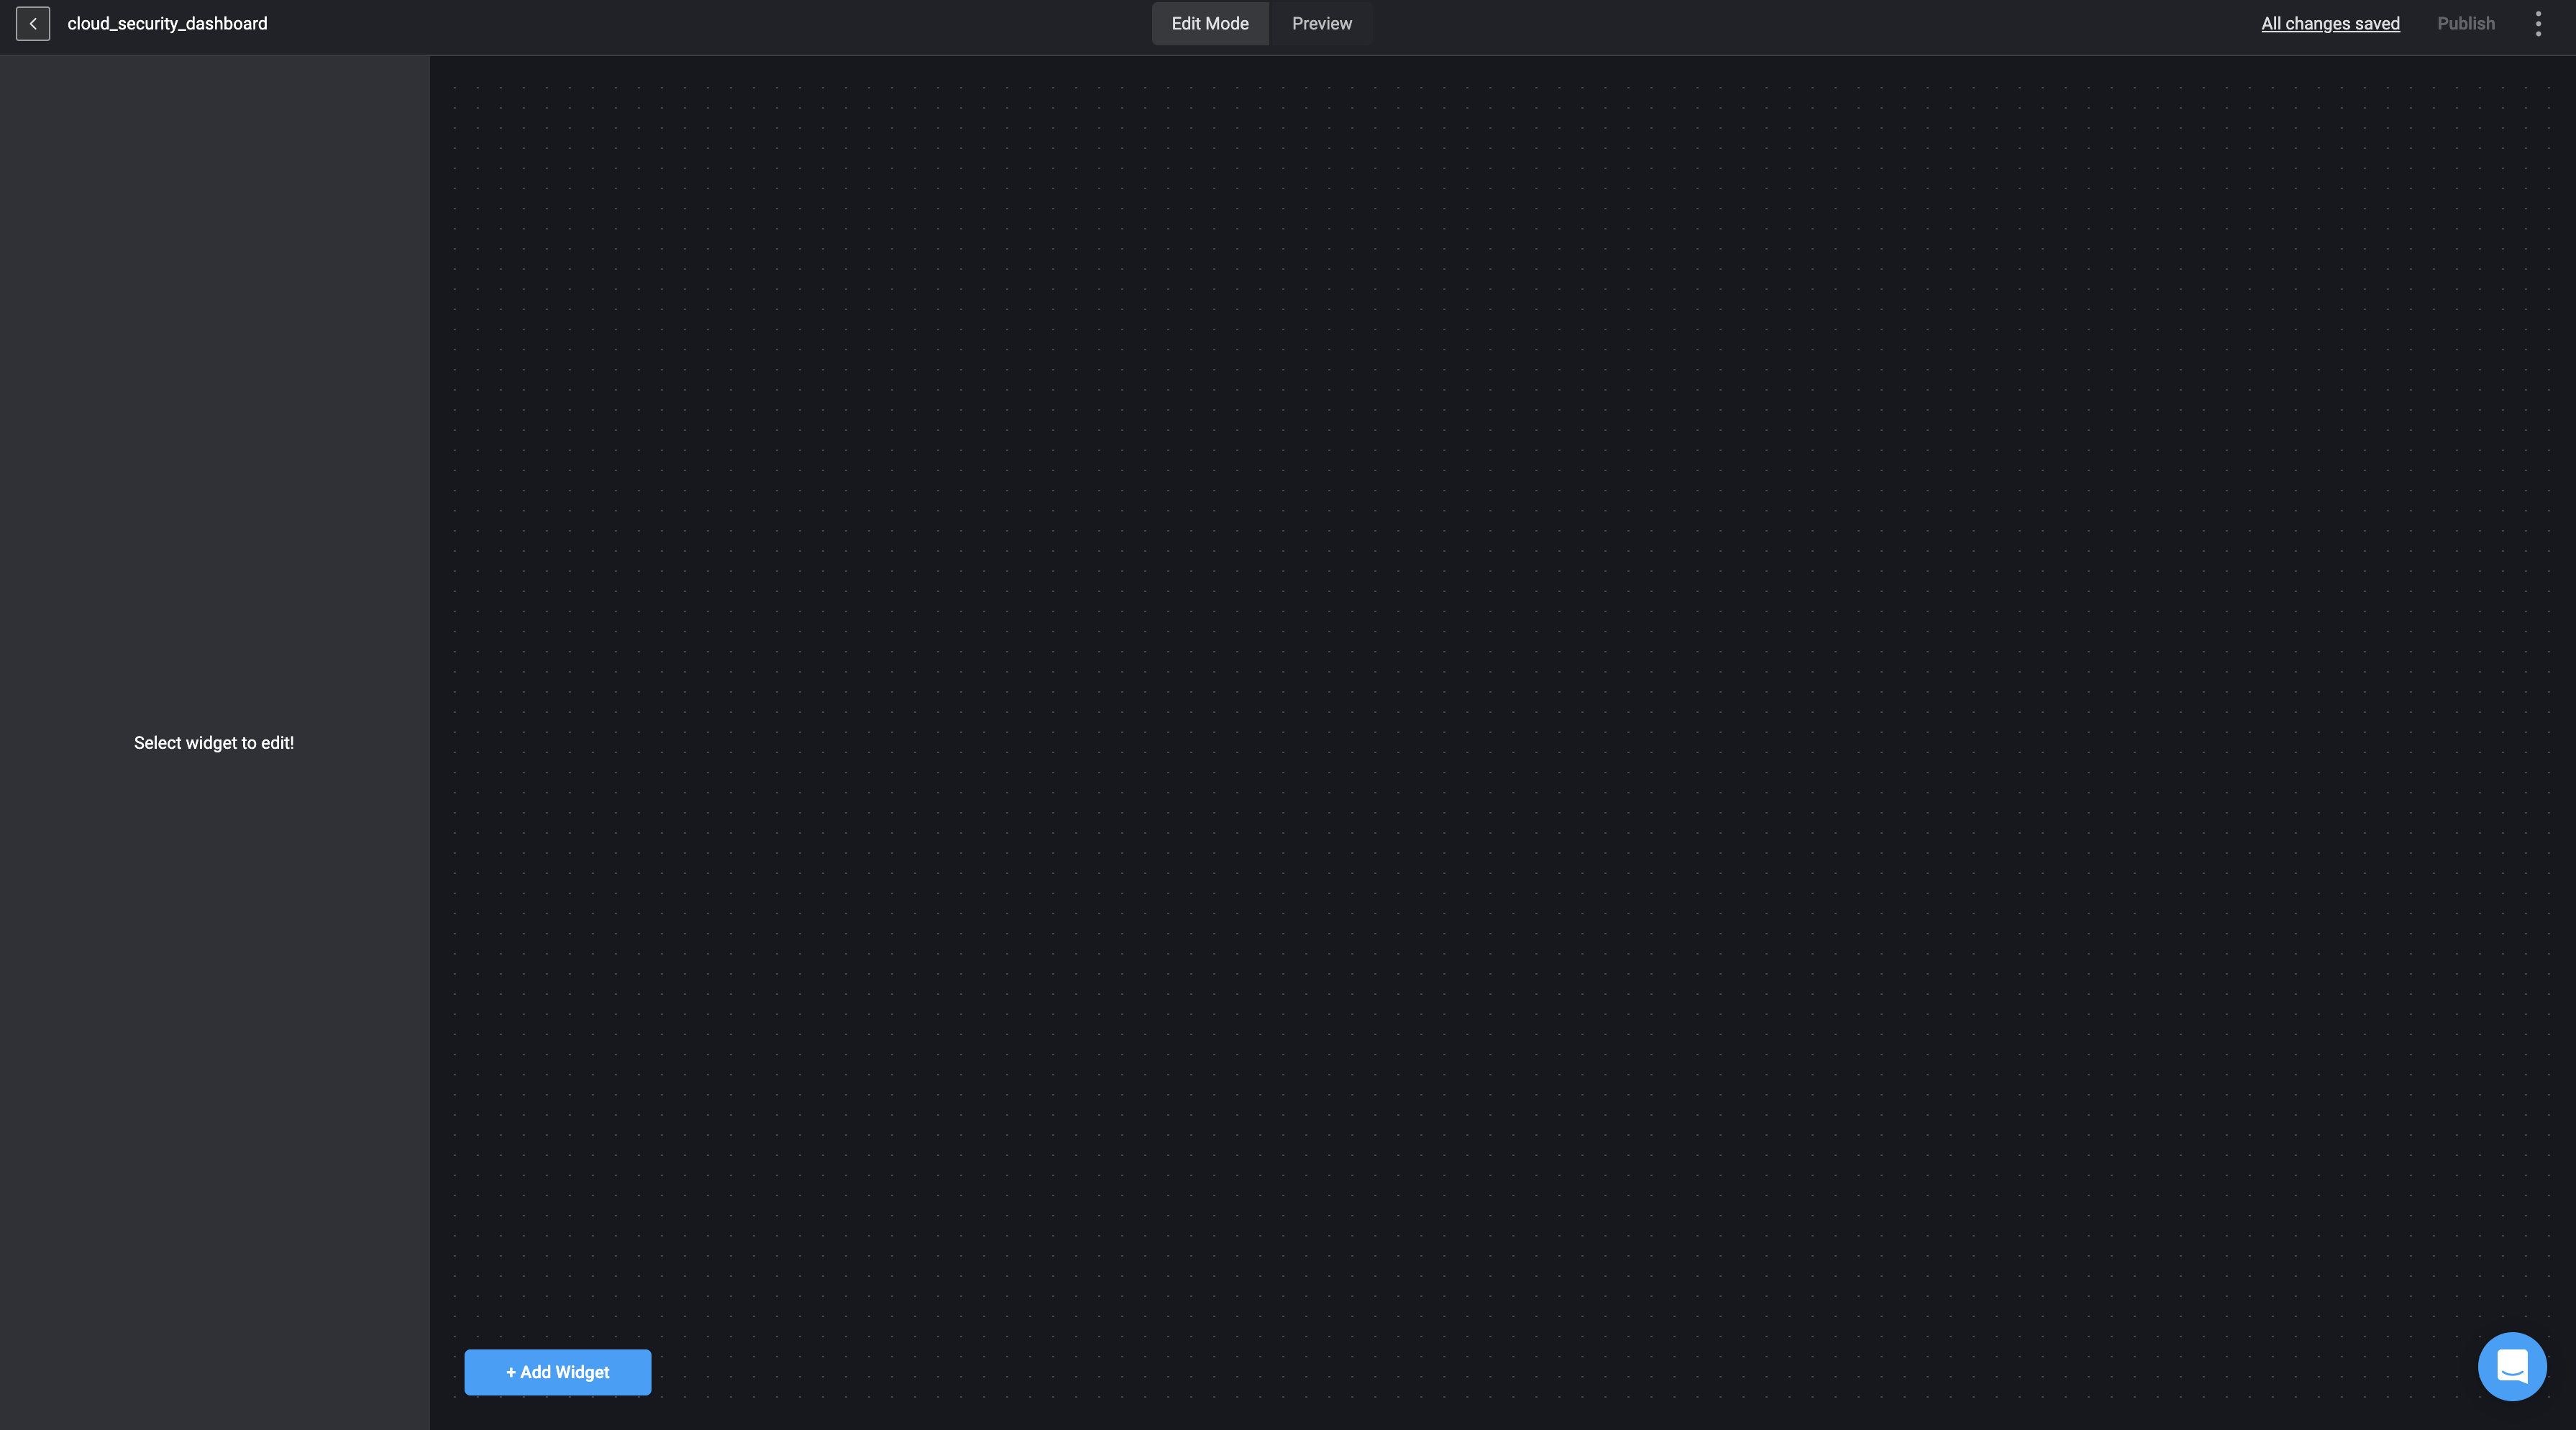
 6. You will then be directed to the [Dashboard Building Interface](/docs/blink-platform/dashboards/building-a-dashboard/building-a-dashboard#dashboard-building-interface) where you can start building your dashboard using [Widgets](/docs/blink-platform/dashboards/building-a-dashboard/widgets/widgets).
 # Dashboard Building Interface
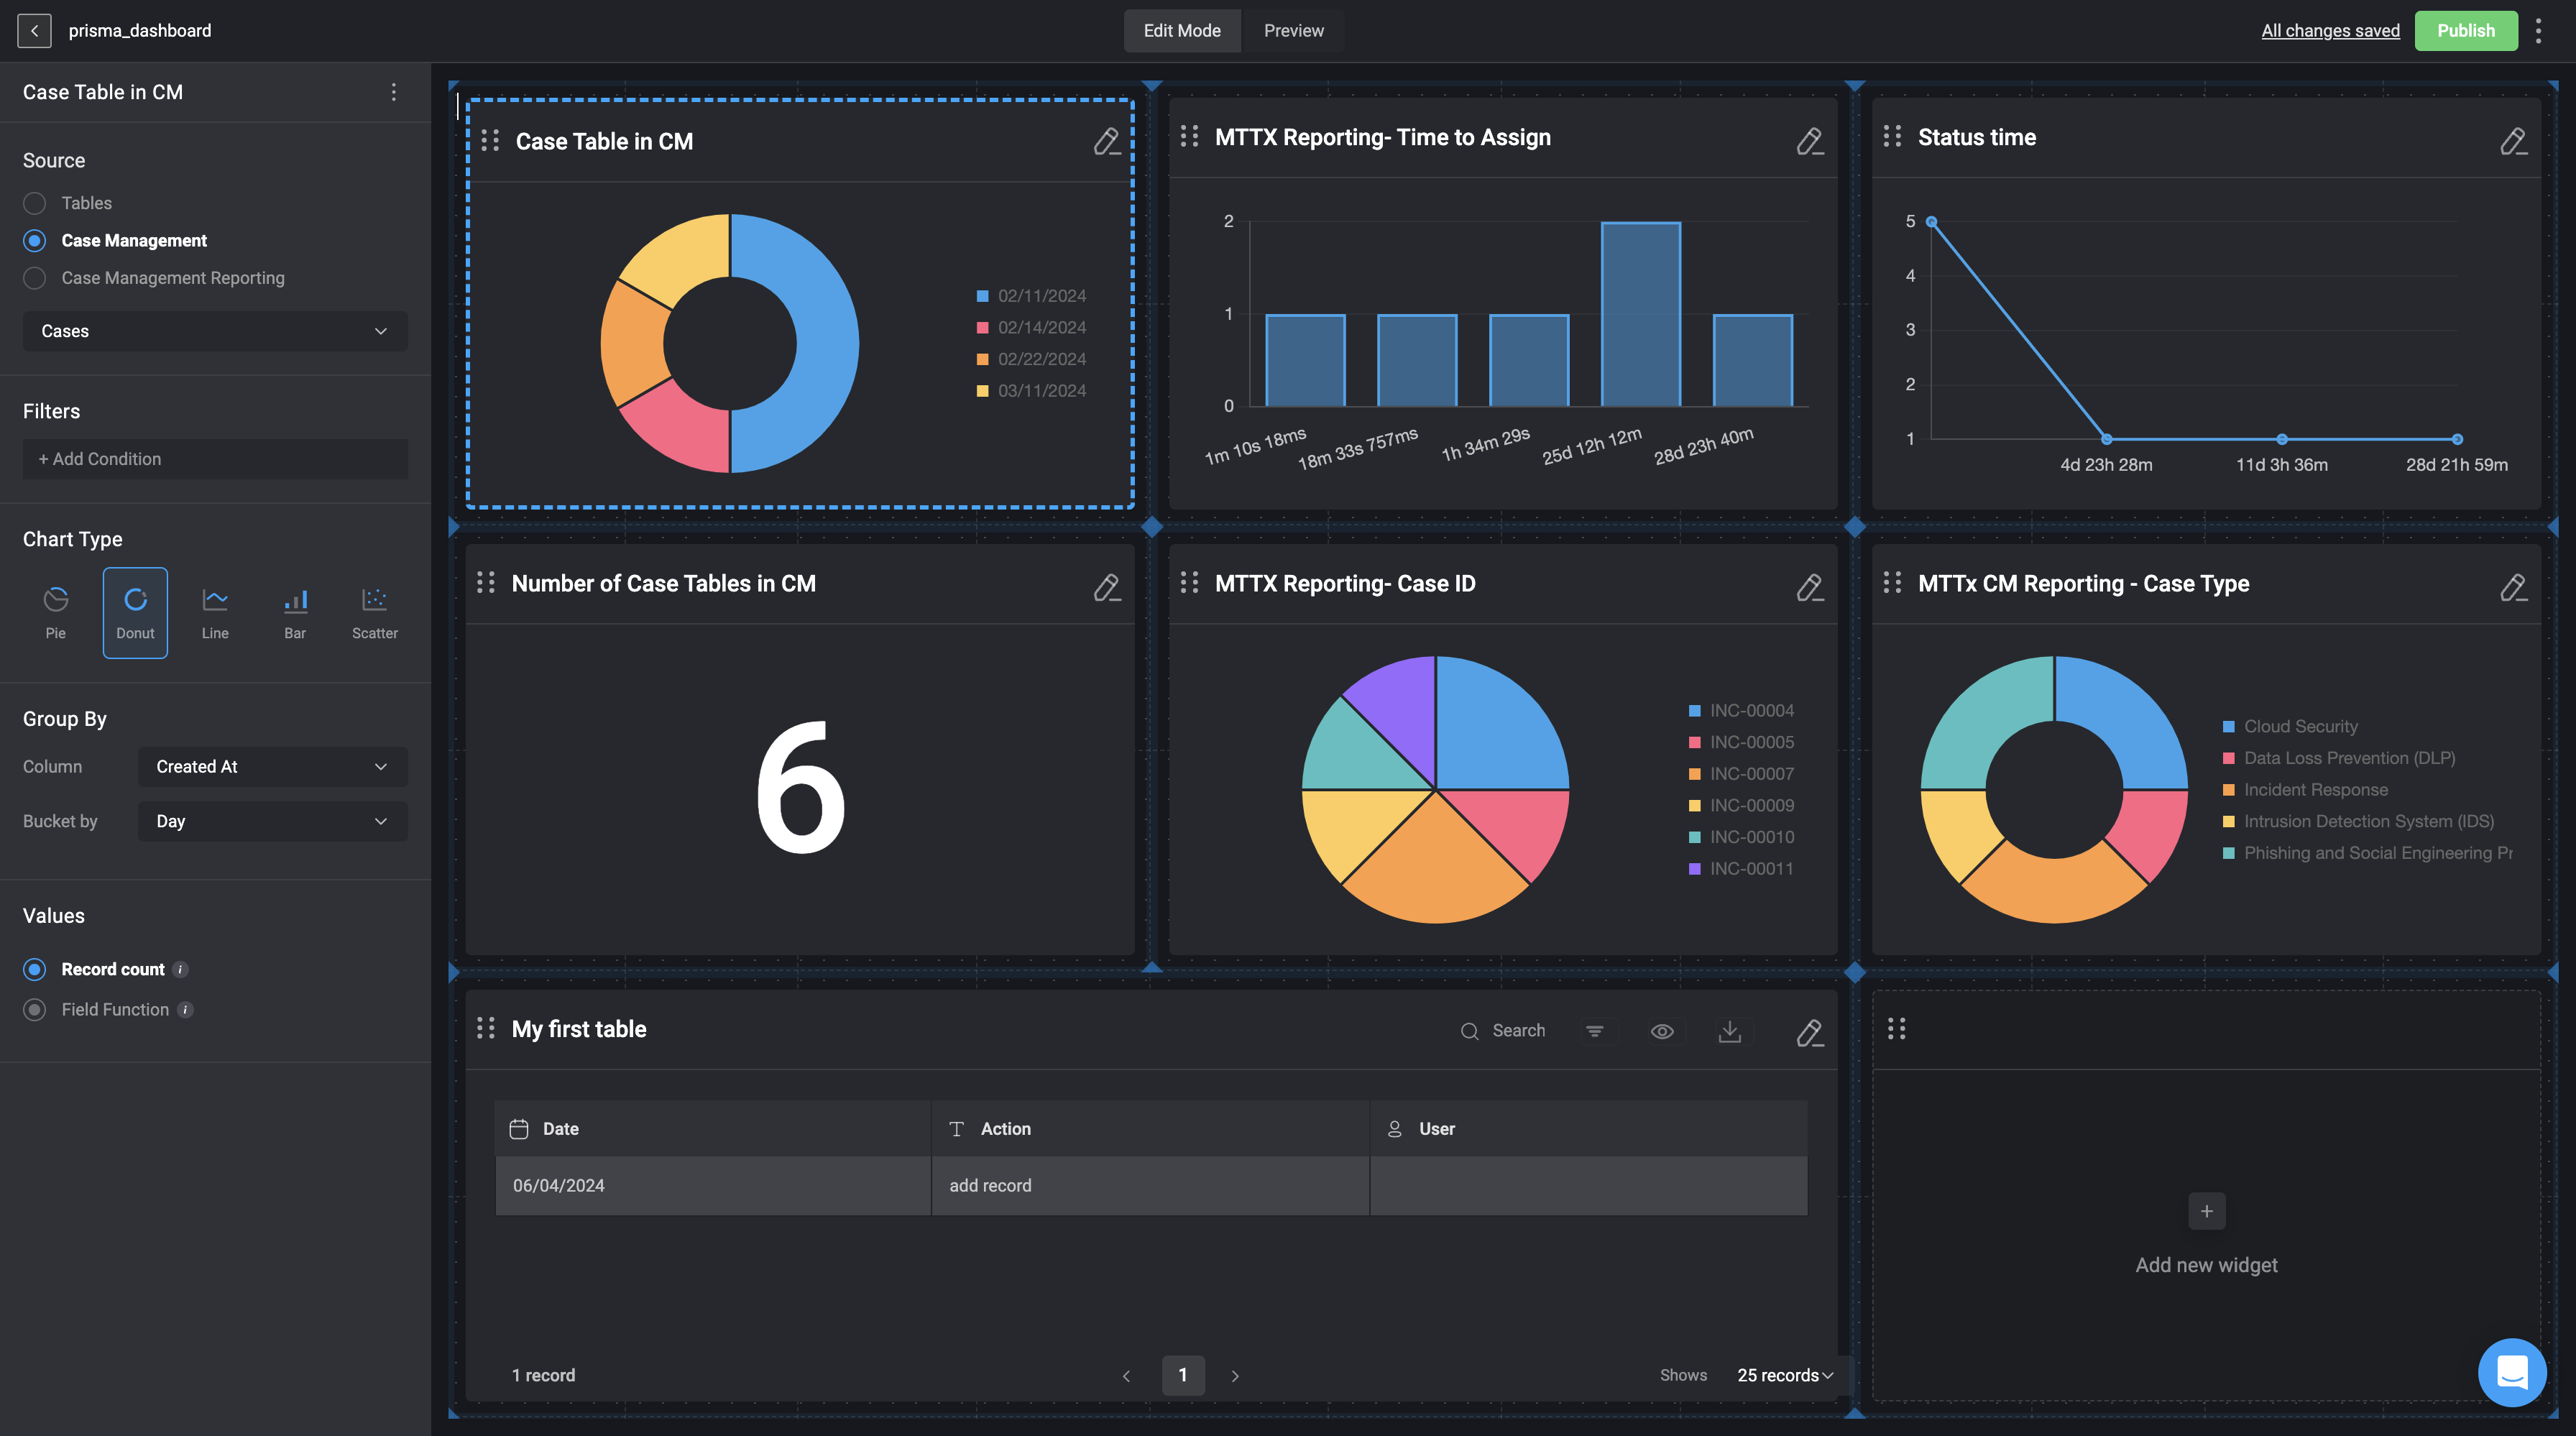
The Dashboard Building Interfaces reflect your underlying source data and are represented by different types of widgets. [Widgets](/docs/blink-platform/dashboards/building-a-dashboard/widgets/widgets) are the essential building blocks of the Dashboard Building Interfaces. [Widgets](/docs/blink-platform/dashboards/building-a-dashboard/widgets/widgets) enable you and other collaborators to see and interact with your table’s data in real time.
***
## Dashboard Building Interface Tabs
The Dashboard Building Interface consists of two distinct tabs:
### Editor Mode
In the 'Editor Mode' tab of the Dashboard Building Interface, you can begin building your dashboard by selecting a [data source](/docs/blink-platform/dashboards/building-a-dashboard/source-types/source-types) and selecting [Widgets](/docs/blink-platform/dashboards/building-a-dashboard/widgets/widgets) to represent the data.
# Dashboard Building Interface
The Dashboard Building Interfaces reflect your underlying source data and are represented by different types of widgets. [Widgets](/docs/blink-platform/dashboards/building-a-dashboard/widgets/widgets) are the essential building blocks of the Dashboard Building Interfaces. [Widgets](/docs/blink-platform/dashboards/building-a-dashboard/widgets/widgets) enable you and other collaborators to see and interact with your table’s data in real time.
***
## Dashboard Building Interface Tabs
The Dashboard Building Interface consists of two distinct tabs:
### Editor Mode
In the 'Editor Mode' tab of the Dashboard Building Interface, you can begin building your dashboard by selecting a [data source](/docs/blink-platform/dashboards/building-a-dashboard/source-types/source-types) and selecting [Widgets](/docs/blink-platform/dashboards/building-a-dashboard/widgets/widgets) to represent the data.
 ### Preview
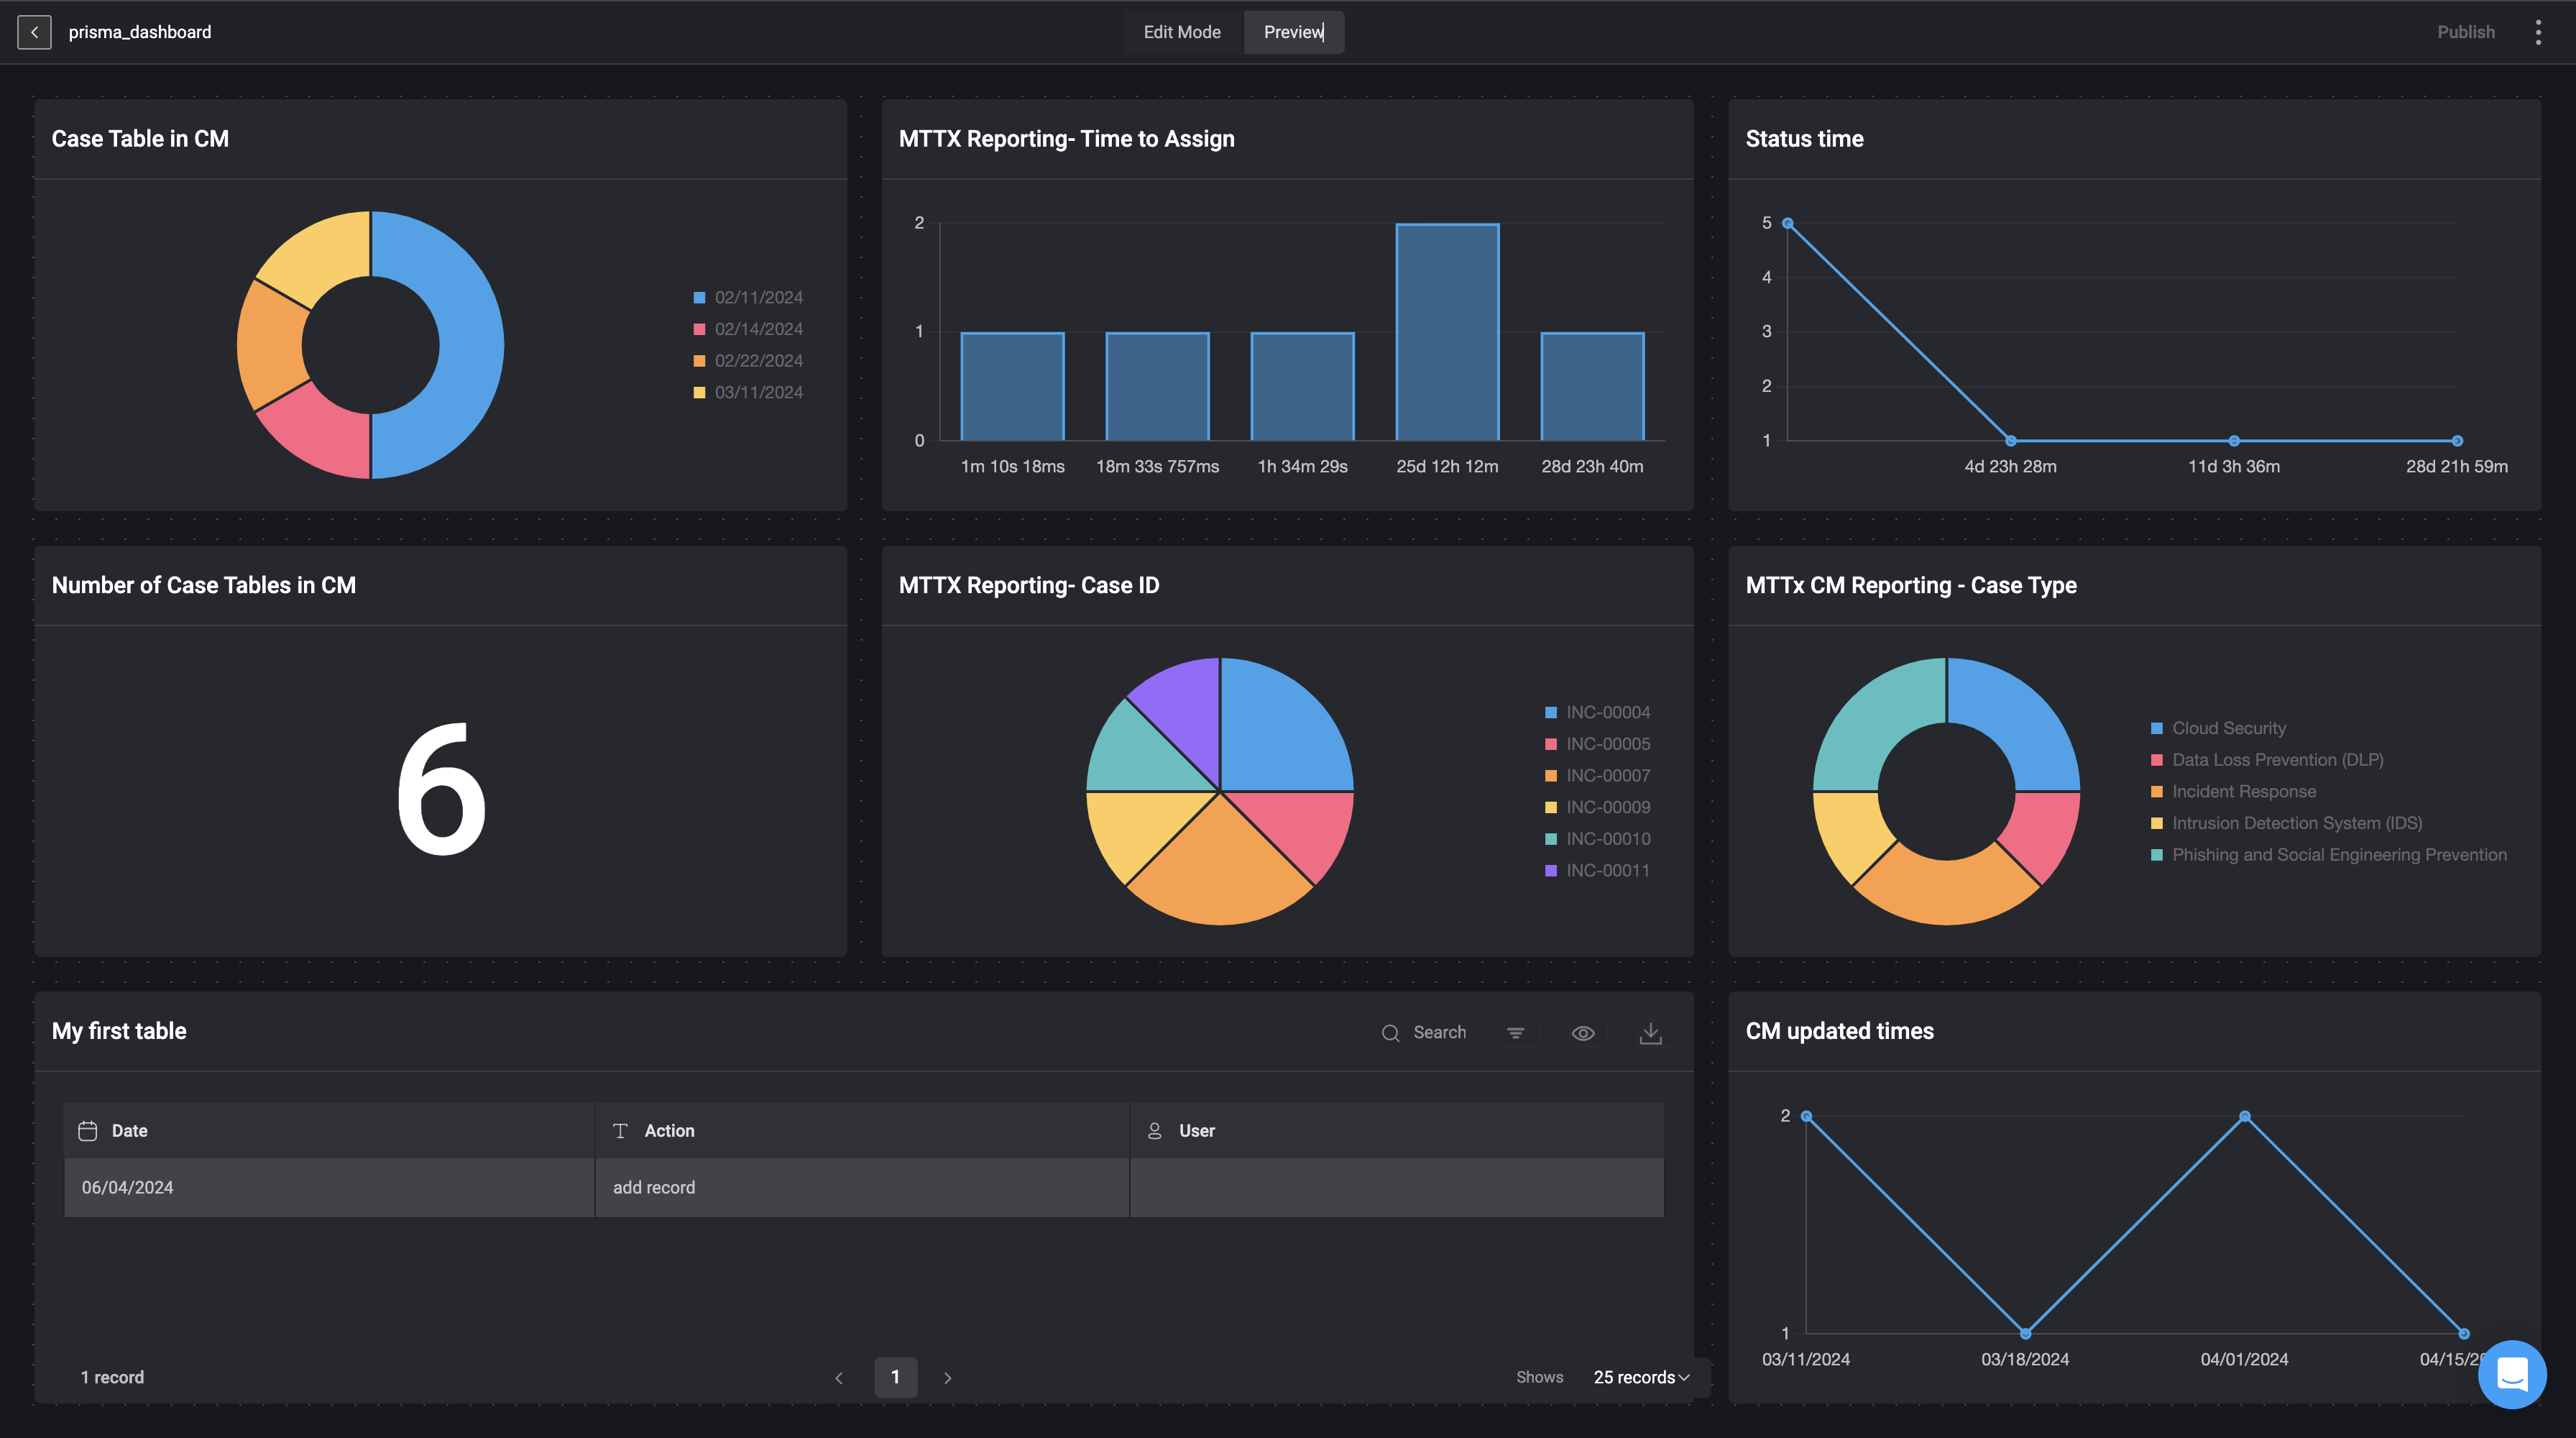
In the preview tab of the Dashboard Building Interface, you can view the dashboard you have recently created and how it will look if you choose to activate and publish the dashboard via the [Self-Service Portal](/docs/blink-platform/dashboards/consume-dashboards-via-self-service-portal)
### Preview
In the preview tab of the Dashboard Building Interface, you can view the dashboard you have recently created and how it will look if you choose to activate and publish the dashboard via the [Self-Service Portal](/docs/blink-platform/dashboards/consume-dashboards-via-self-service-portal)
 ## Dashboard Widget's Expanded View
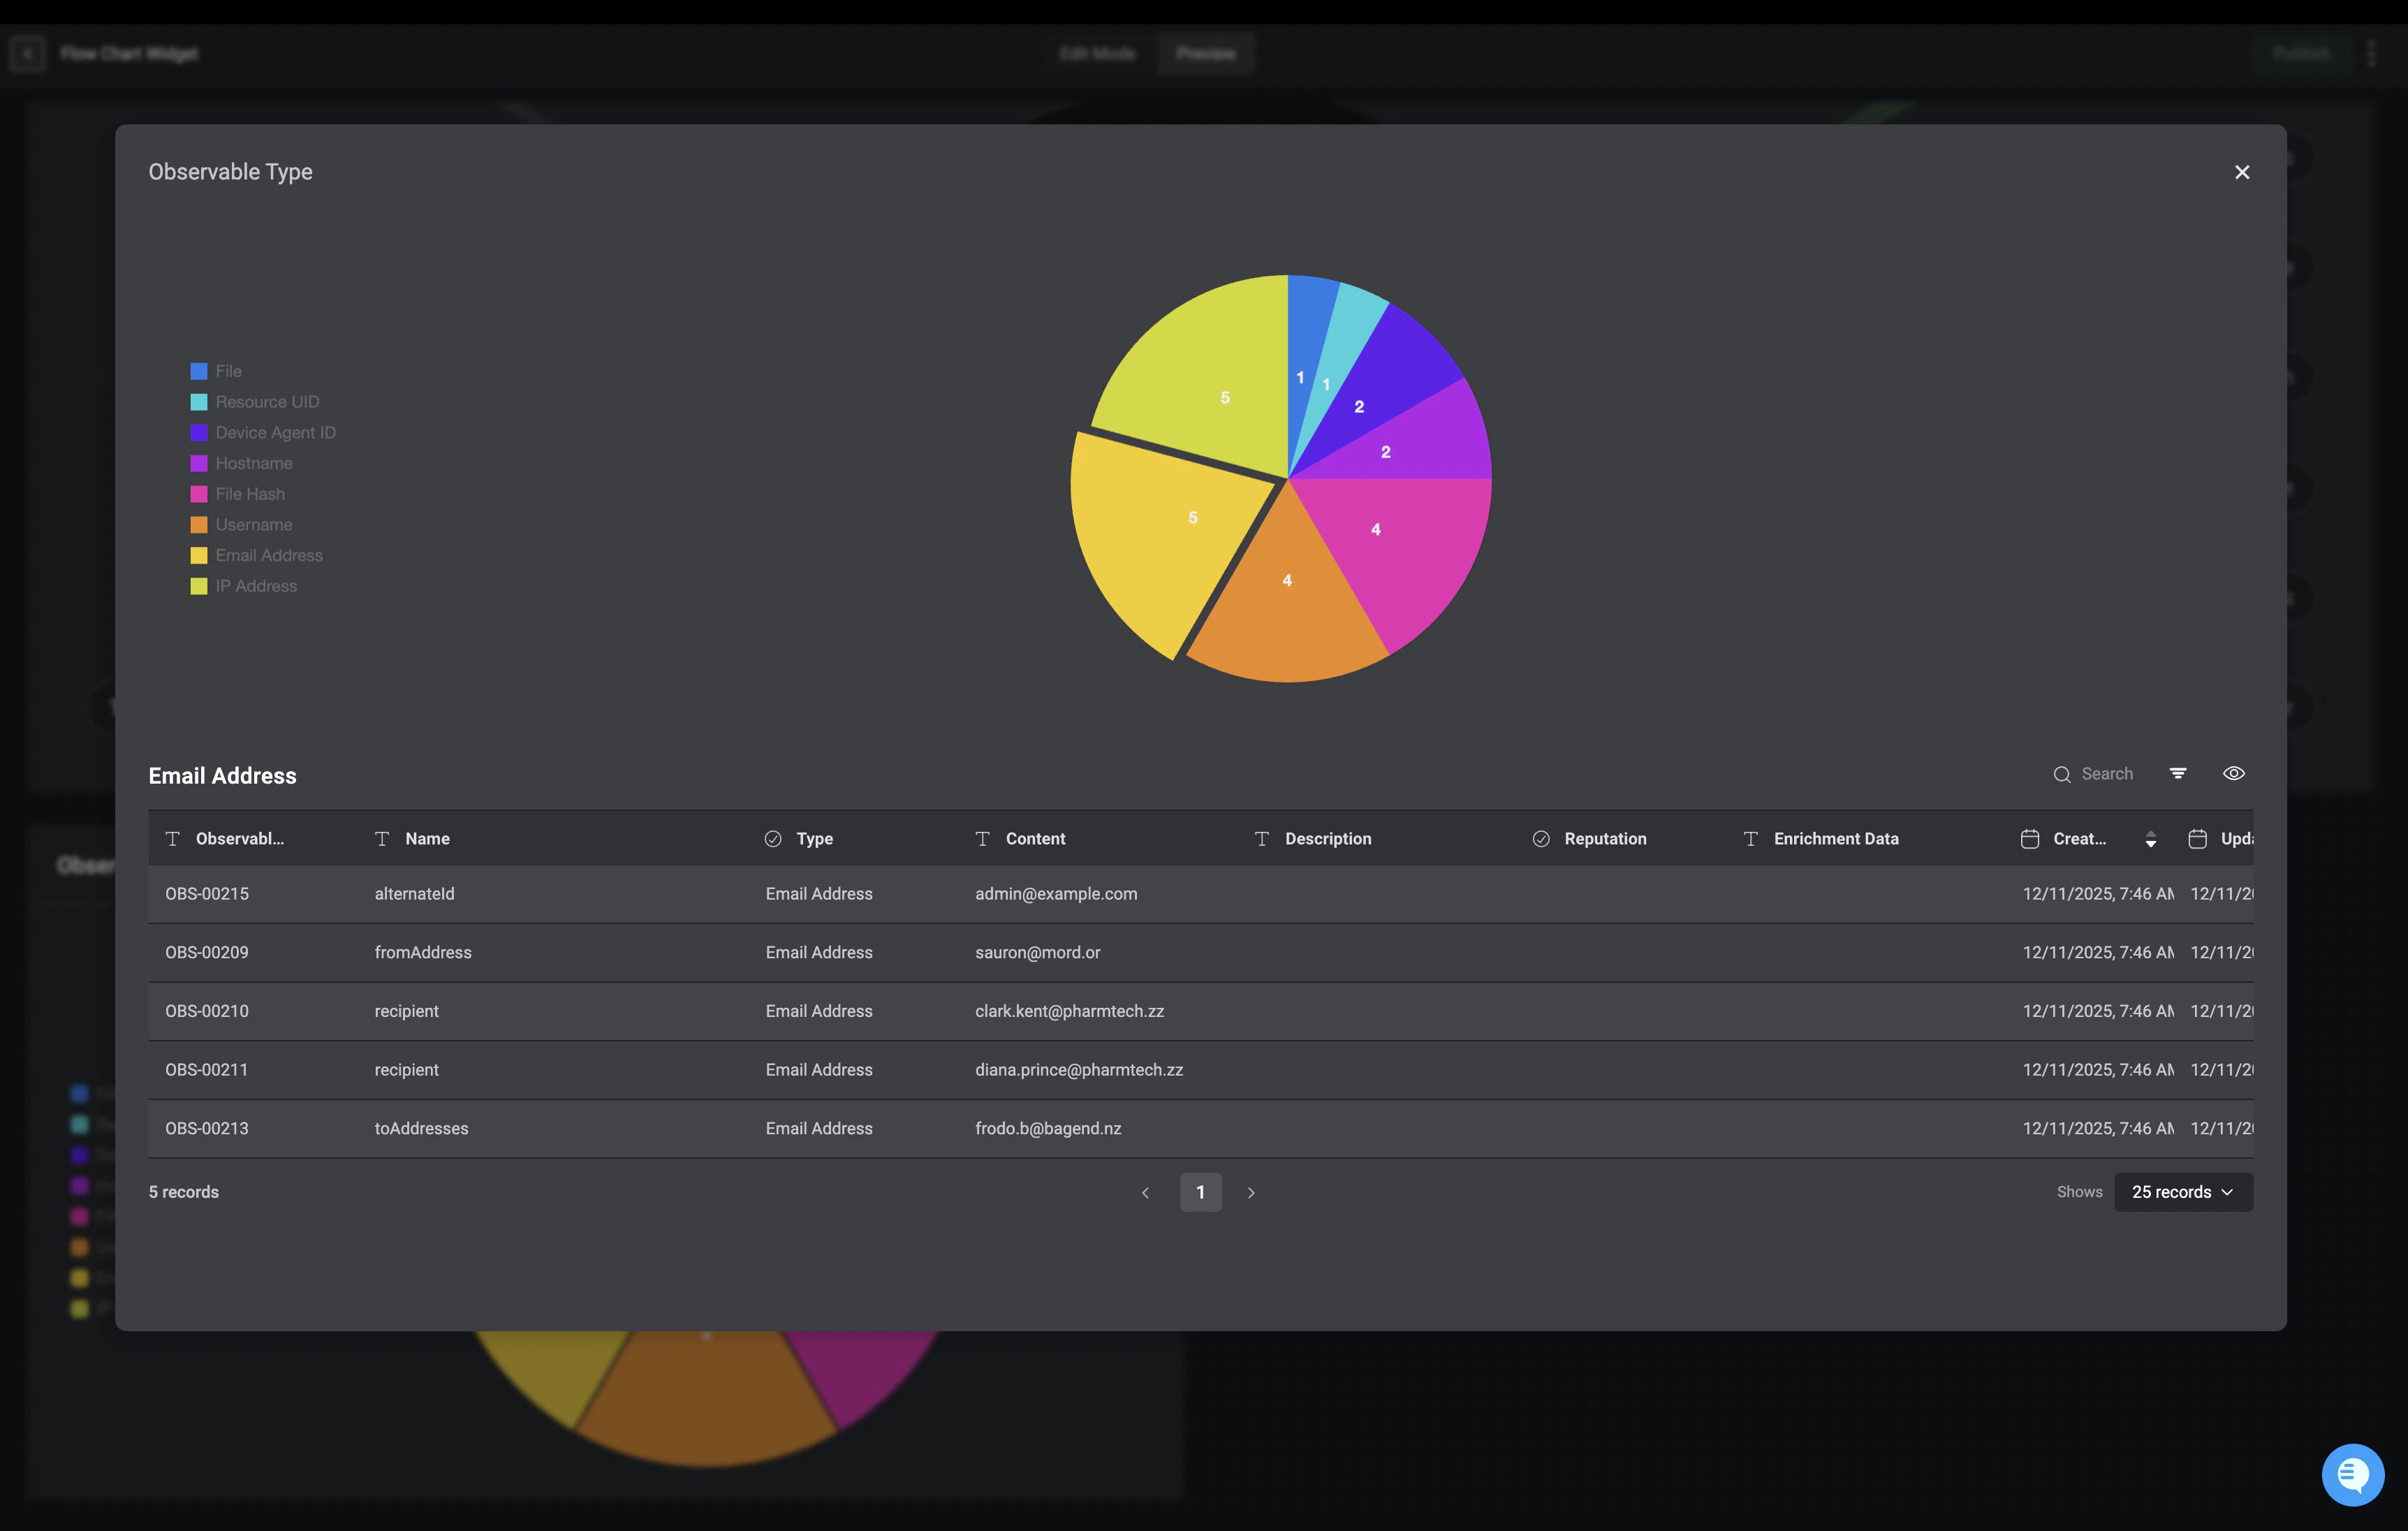
In the dashboard's [preview mode](/docs/blink-platform/dashboards/building-a-dashboard/building-a-dashboard#preview), you can click on a widget to open an expanded view that displays the underlying raw data from the widget’s data source.
Within this expanded view, you can also interact directly with elements of the visualization to further refine the data being displayed. For example, selecting a specific slice in a pie chart or an individual bar in a bar chart will filter the results to show only the raw records associated with that selected element.
This allows you to quickly drill down into the data behind specific parts of the visualization directly from the dashboard.
**Note:** When a widget is grouped by a user field (e.g., Case Manager or custom user fields), the expanded view shows the full underlying dataset
## Dashboard Widget's Expanded View
In the dashboard's [preview mode](/docs/blink-platform/dashboards/building-a-dashboard/building-a-dashboard#preview), you can click on a widget to open an expanded view that displays the underlying raw data from the widget’s data source.
Within this expanded view, you can also interact directly with elements of the visualization to further refine the data being displayed. For example, selecting a specific slice in a pie chart or an individual bar in a bar chart will filter the results to show only the raw records associated with that selected element.
This allows you to quickly drill down into the data behind specific parts of the visualization directly from the dashboard.
**Note:** When a widget is grouped by a user field (e.g., Case Manager or custom user fields), the expanded view shows the full underlying dataset
 ## Customize the Dashboard Building Interface
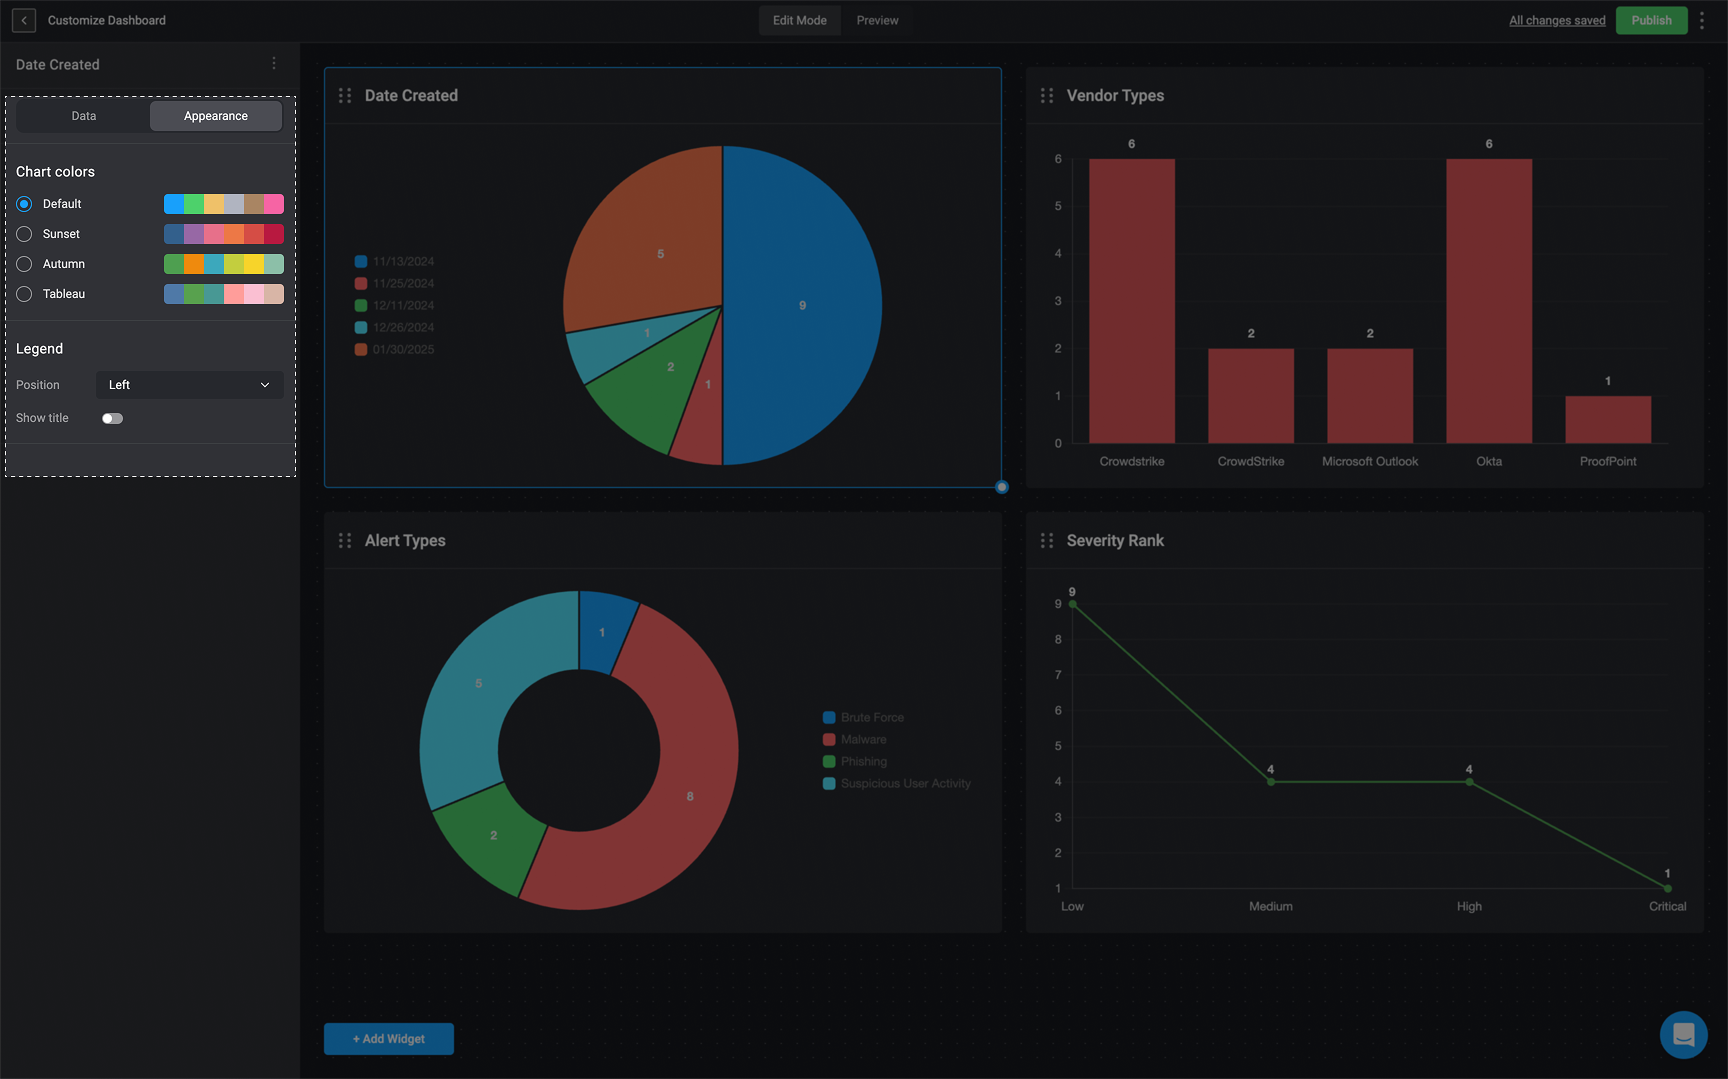
You can customize the appearance of a [chart widget](/docs/blink-platform/dashboards/building-a-dashboard/widgets/charts) by selecting a color palette, adjusting the legend, and modifying the X and Y axis labels. For more details, visit [this section](/docs/blink-platform/dashboards/building-a-dashboard/widgets/charts#customize-widget-appearance).
## Customize the Dashboard Building Interface
You can customize the appearance of a [chart widget](/docs/blink-platform/dashboards/building-a-dashboard/widgets/charts) by selecting a color palette, adjusting the legend, and modifying the X and Y axis labels. For more details, visit [this section](/docs/blink-platform/dashboards/building-a-dashboard/widgets/charts#customize-widget-appearance).
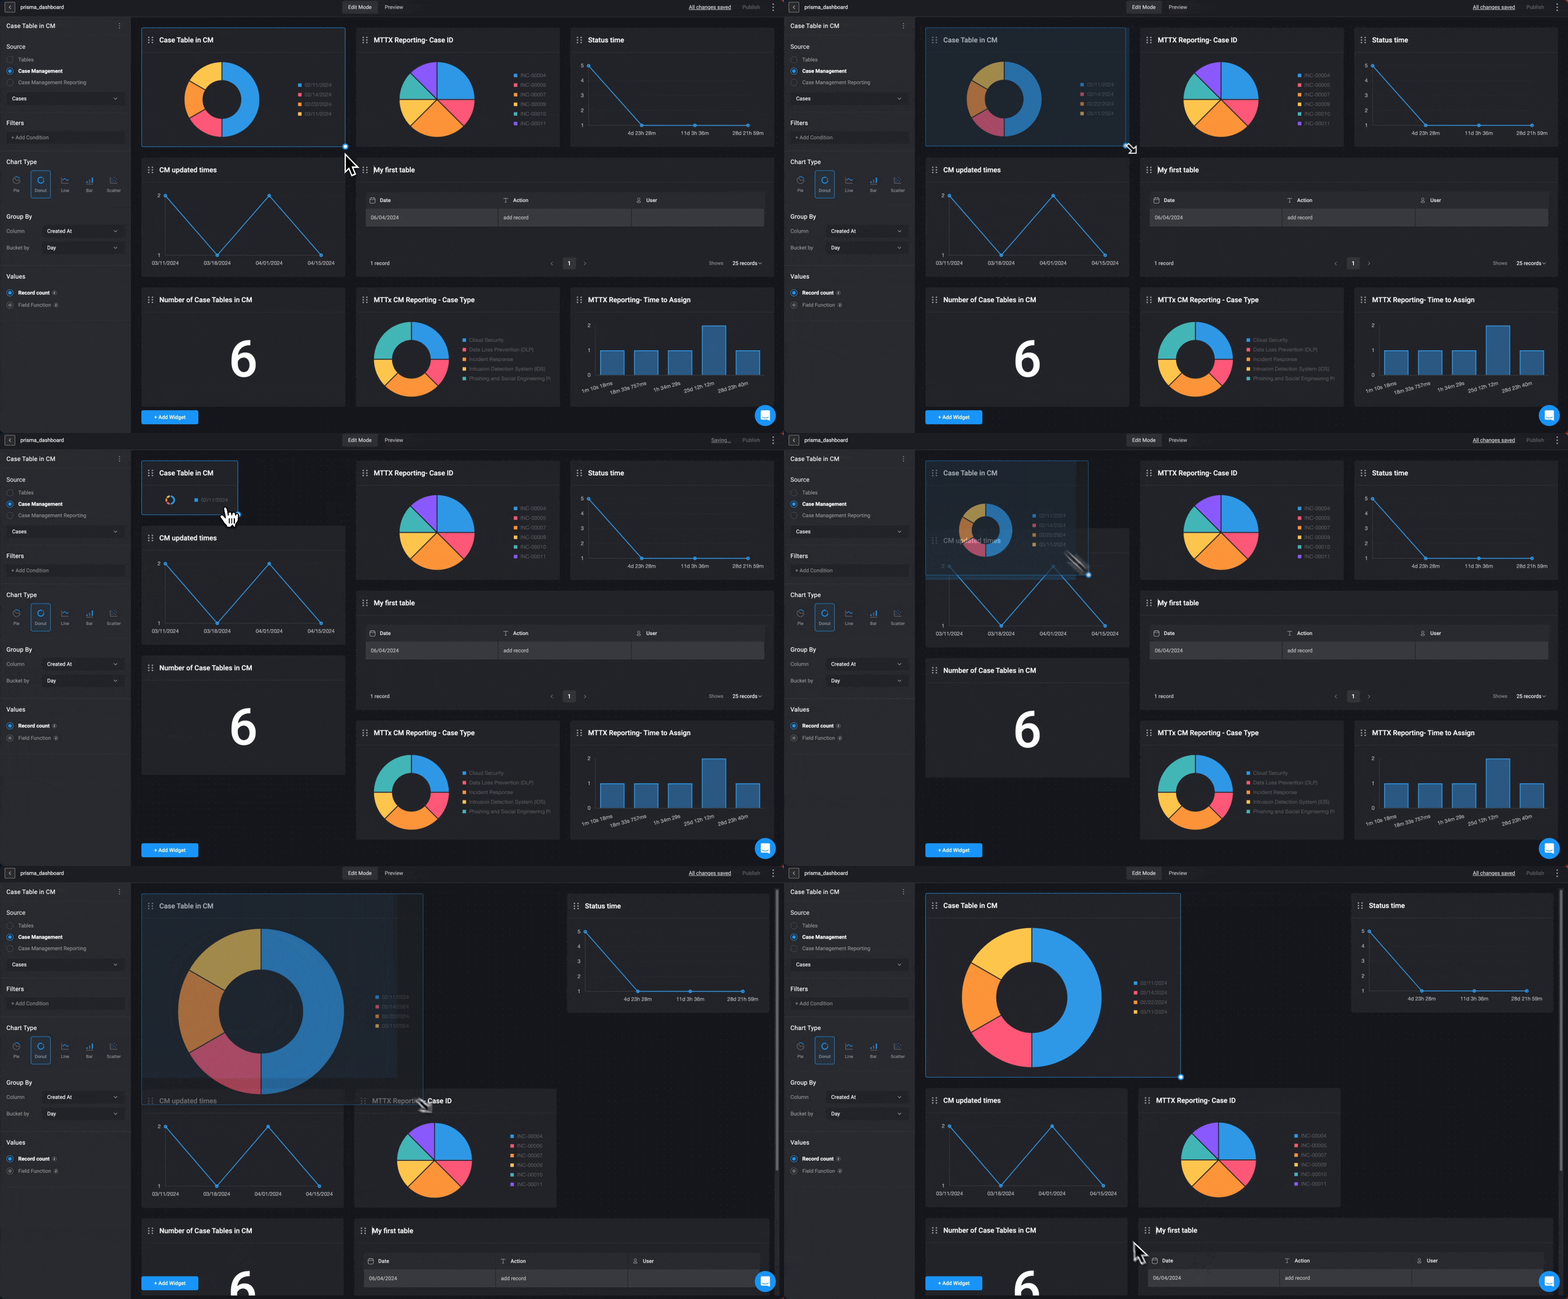
 You can customize the layout of your Dashboard Building Interface by selecting a widget and then dragging and dropping it to your desired location.
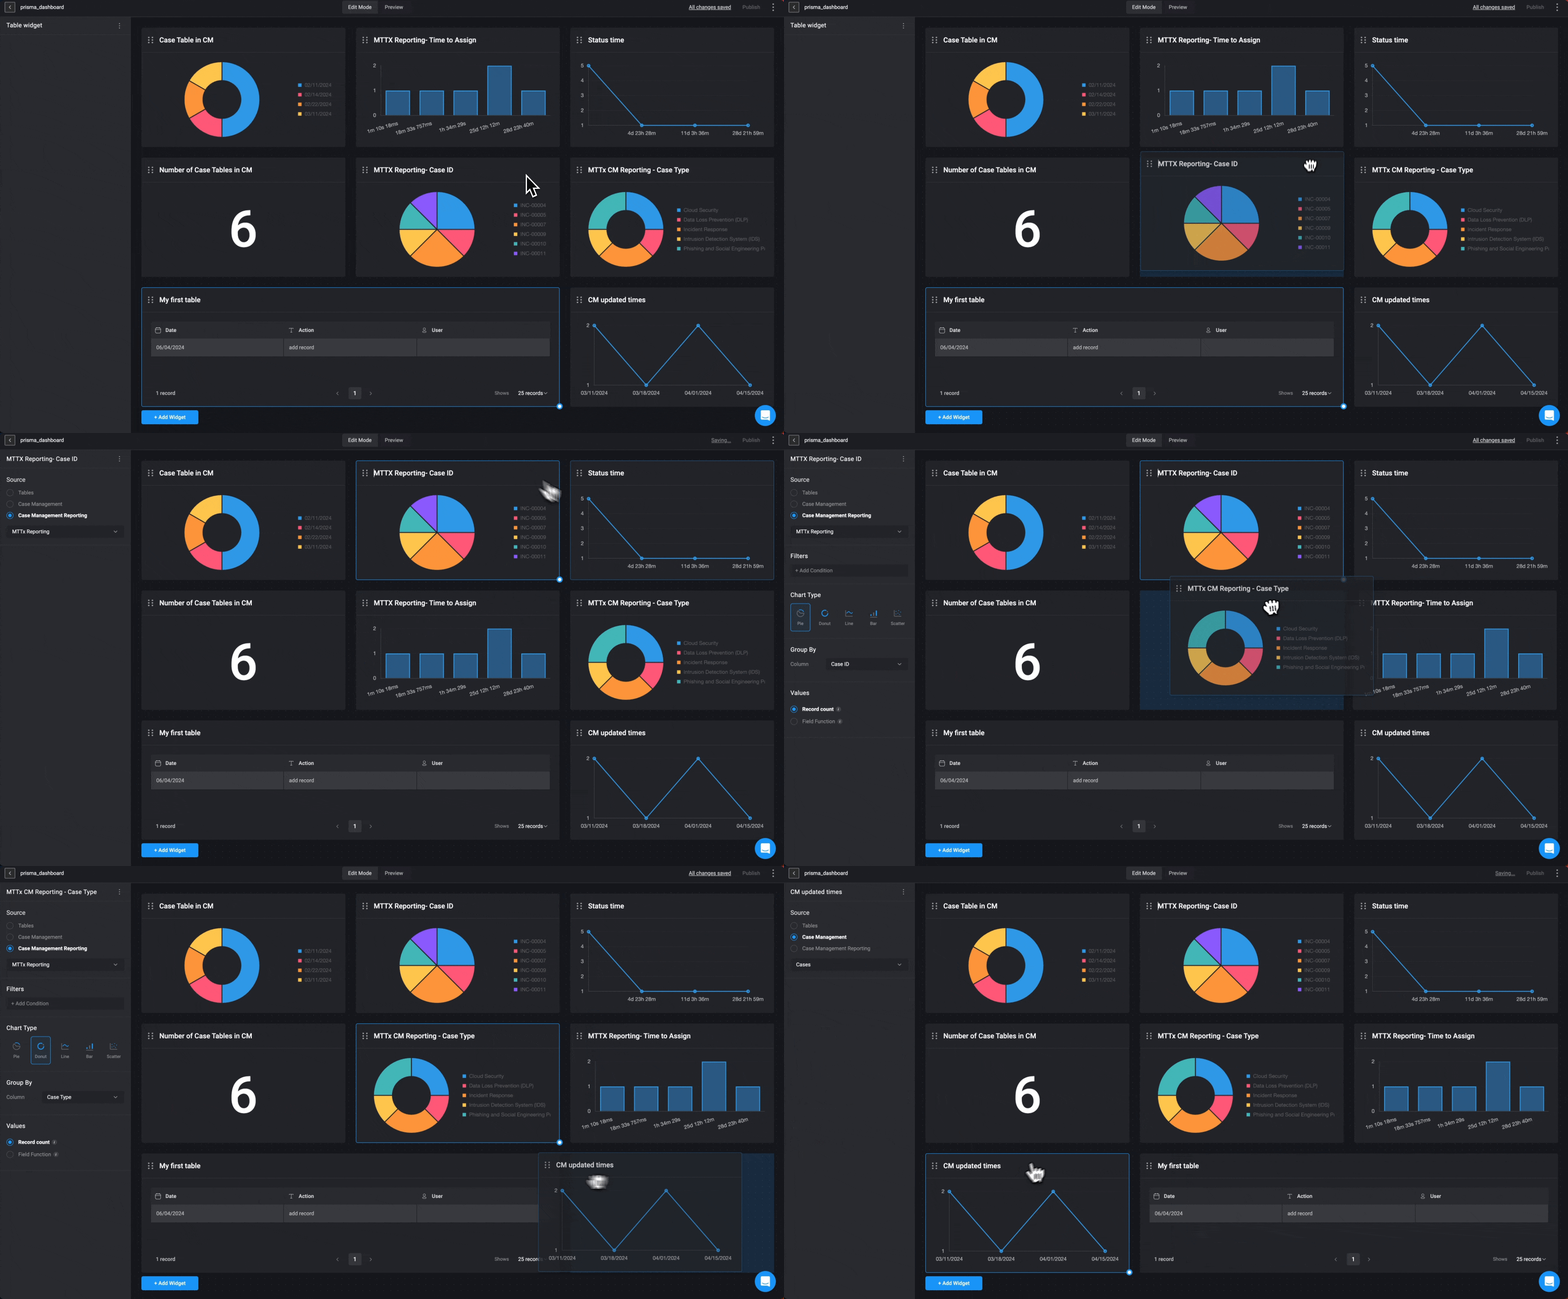 You can also adjust the size of your widgets by selecting the bottom-left corner of the widget and zooming in to shrink it or zooming out to enlarge it.
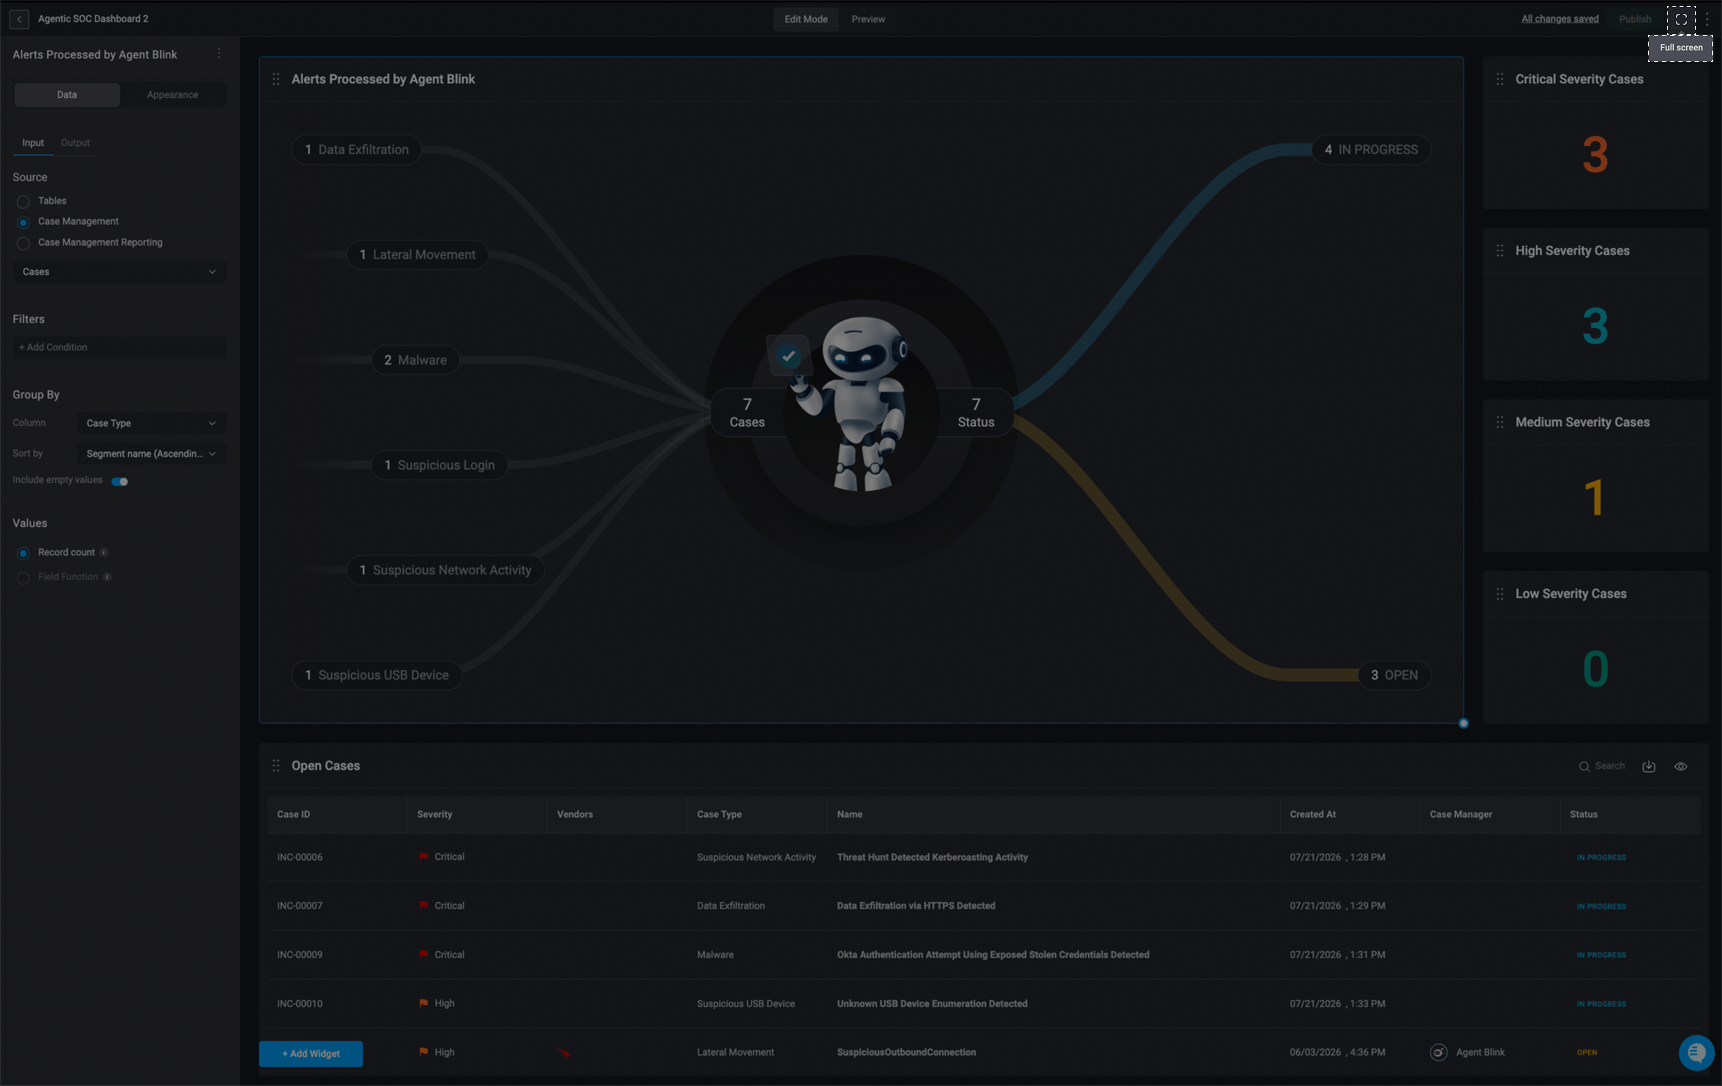
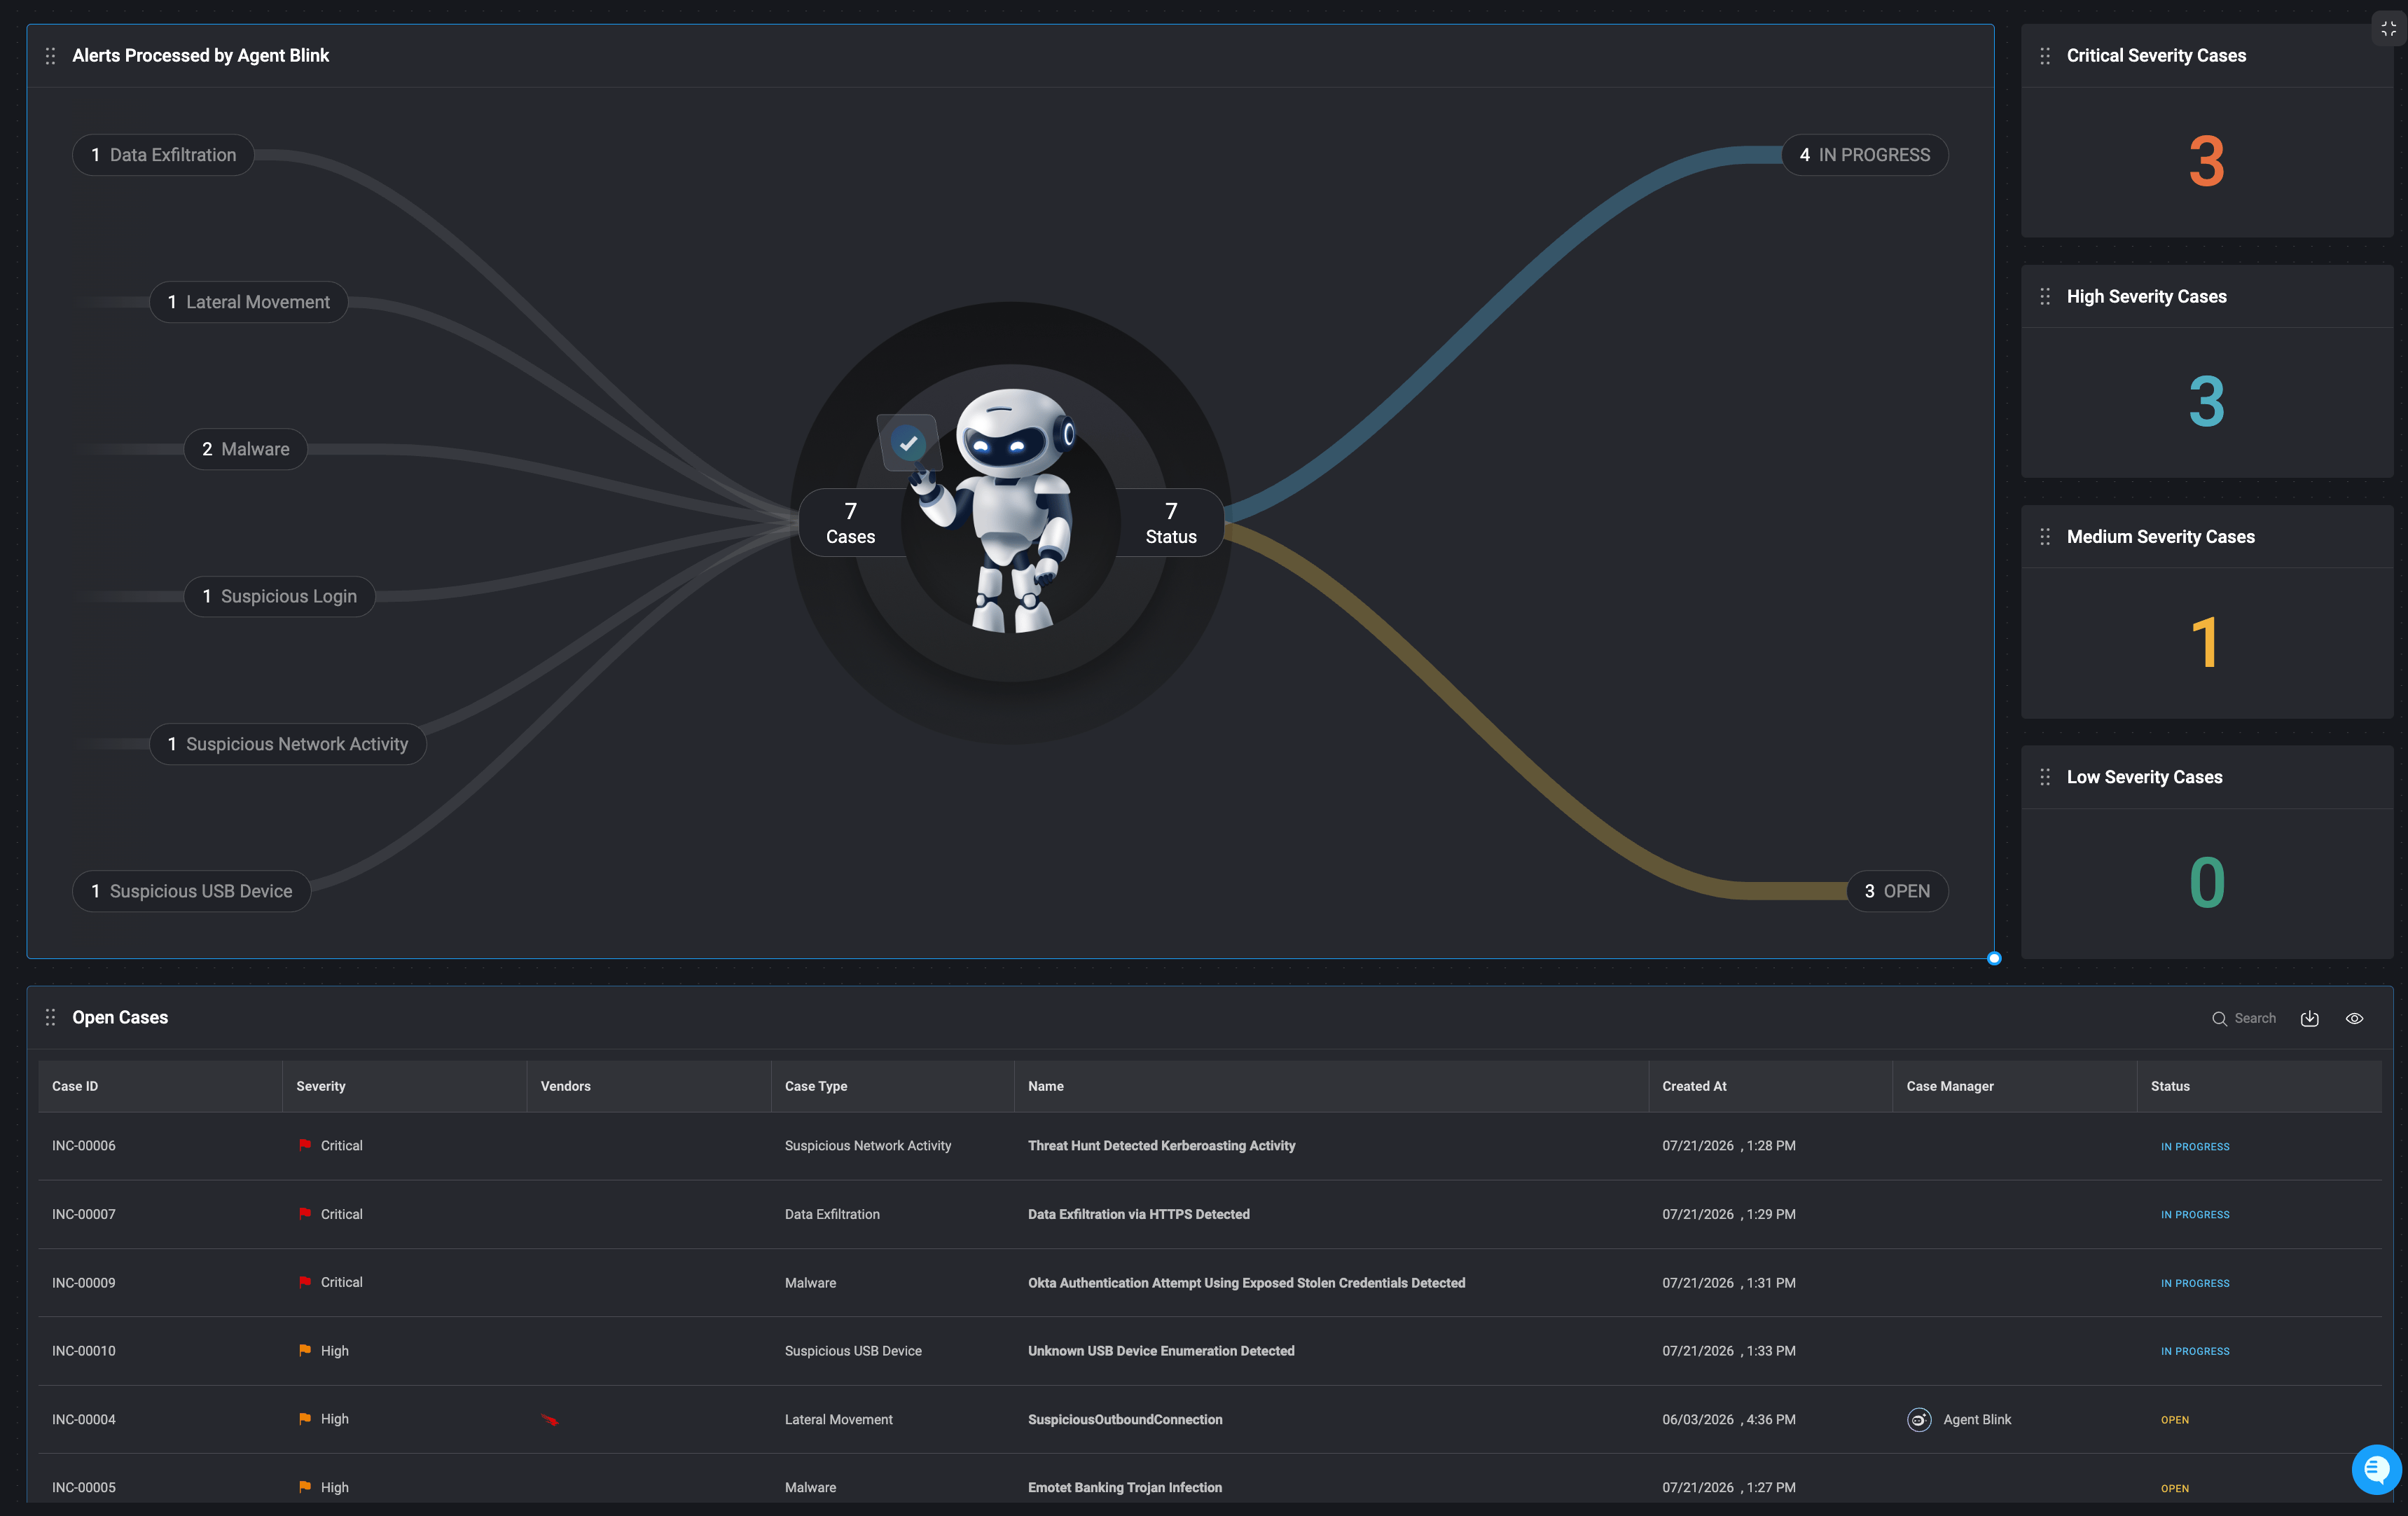
 Select the icon in the top-right corner of the custom HTML widget to view it in full screen.
 ***
## Dashboard Building Interface Settings
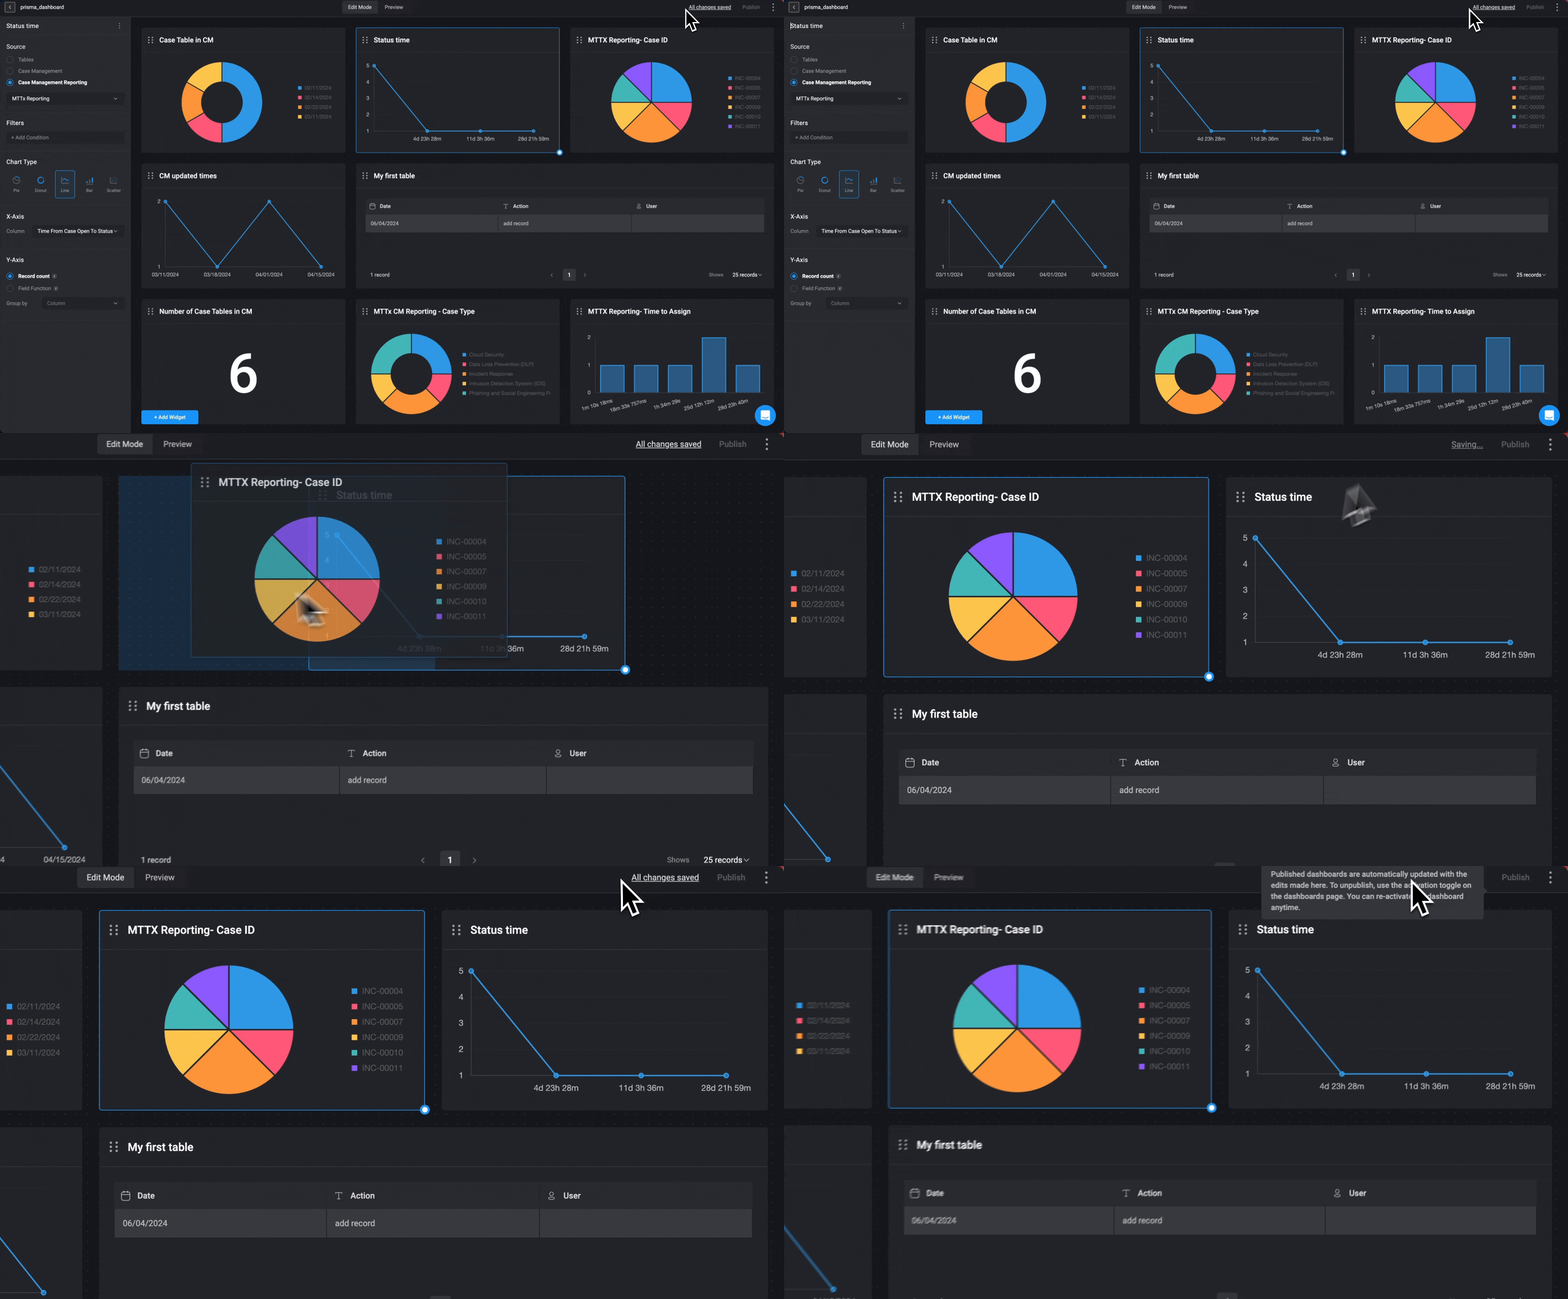
1. When you make any changes to your Dashboard Building Interface, the changes are automatically saved. You will see this in top-right corner of the Dashboard Building Interface.
***
## Dashboard Building Interface Settings
1. When you make any changes to your Dashboard Building Interface, the changes are automatically saved. You will see this in top-right corner of the Dashboard Building Interface.
 2.
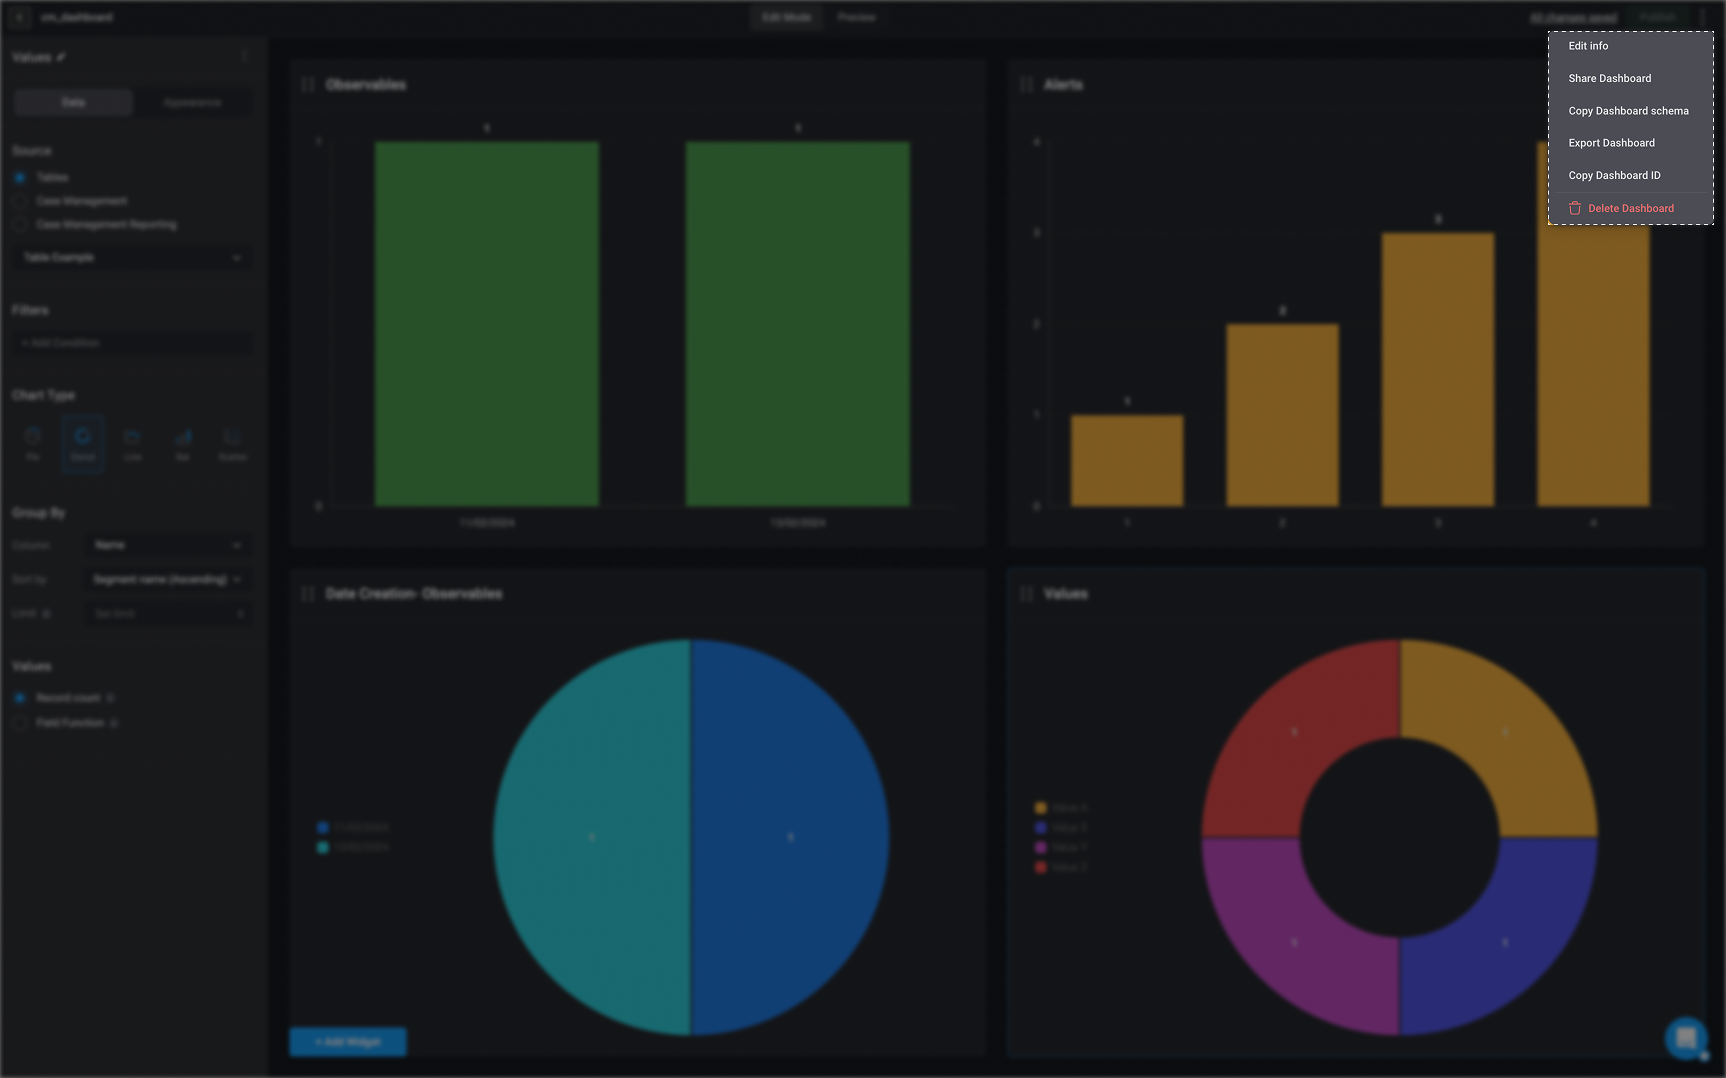
2. In the top-right corner of the Dashboard Builder, click the icon to open a menu with the following options:
1. **Edit Info**: Update your dashboard’s information as needed. After making changes, click **Save Changes** to apply them automatically.
2. **Share Dashboard**: - You can share an **activated** dashboard by entering the name of the user or group you want to share the selected dashboard with.
3. **Copy Dashboard Schema**- Copies the JSON syntax of the selected Dashboard
4. **Export Dashboard**: Download a PDF version of your dashboard for sharing or record-keeping purposes.
**Note**: You can also export a dashboard via the [export dashboard workflow action](/docs/blink-platform/dashboards/dashboard-actions/export-dashboard) or through the [Self-Service Portal](/docs/blink-platform/dashboards/dashboard-actions/export-dashboard#3-through-the-self-service-portal).
5. **Copy Dashboard ID** - Copies the selected Dashboard's unique ID
6. **Delete**: Permanently removes the selected dashboard. Use with caution.
 ***
***