> ## Documentation Index
> Fetch the complete documentation index at: https://docs.blinkops.com/llms.txt
> Use this file to discover all available pages before exploring further.
# The Blink Portal
> Overview of the Blink Portal for sharing workflows, dashboards, and self-service automation with your team.
The Blink Portal is an interface which allows users to execute workflows with a single click, view and export dashboards effortlessly, and tap into the full suite of resources your teams have built, right from one streamlined interface.
**Note**: Although you can run and interact with workflows and dashboards in the Blink Portal, you cannot modify any of the workflows or dashboards displayed there.
***
## Customize the Blink Portal Logo and Header
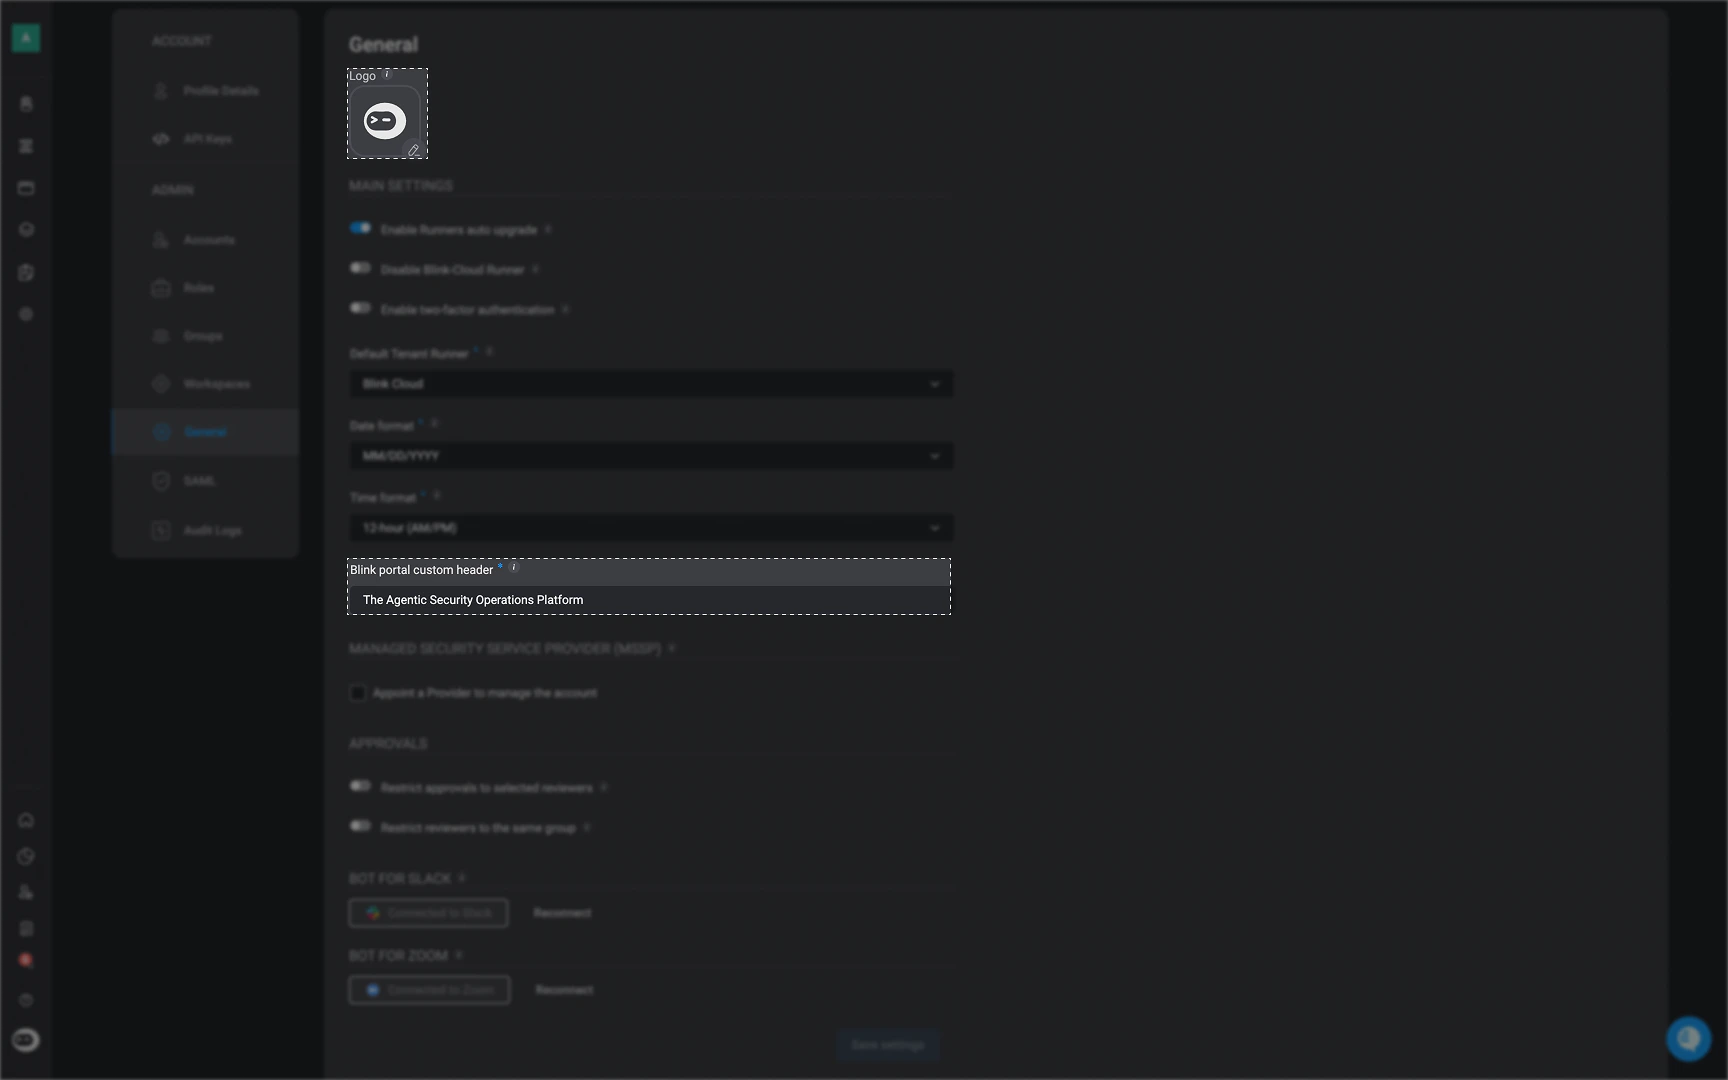
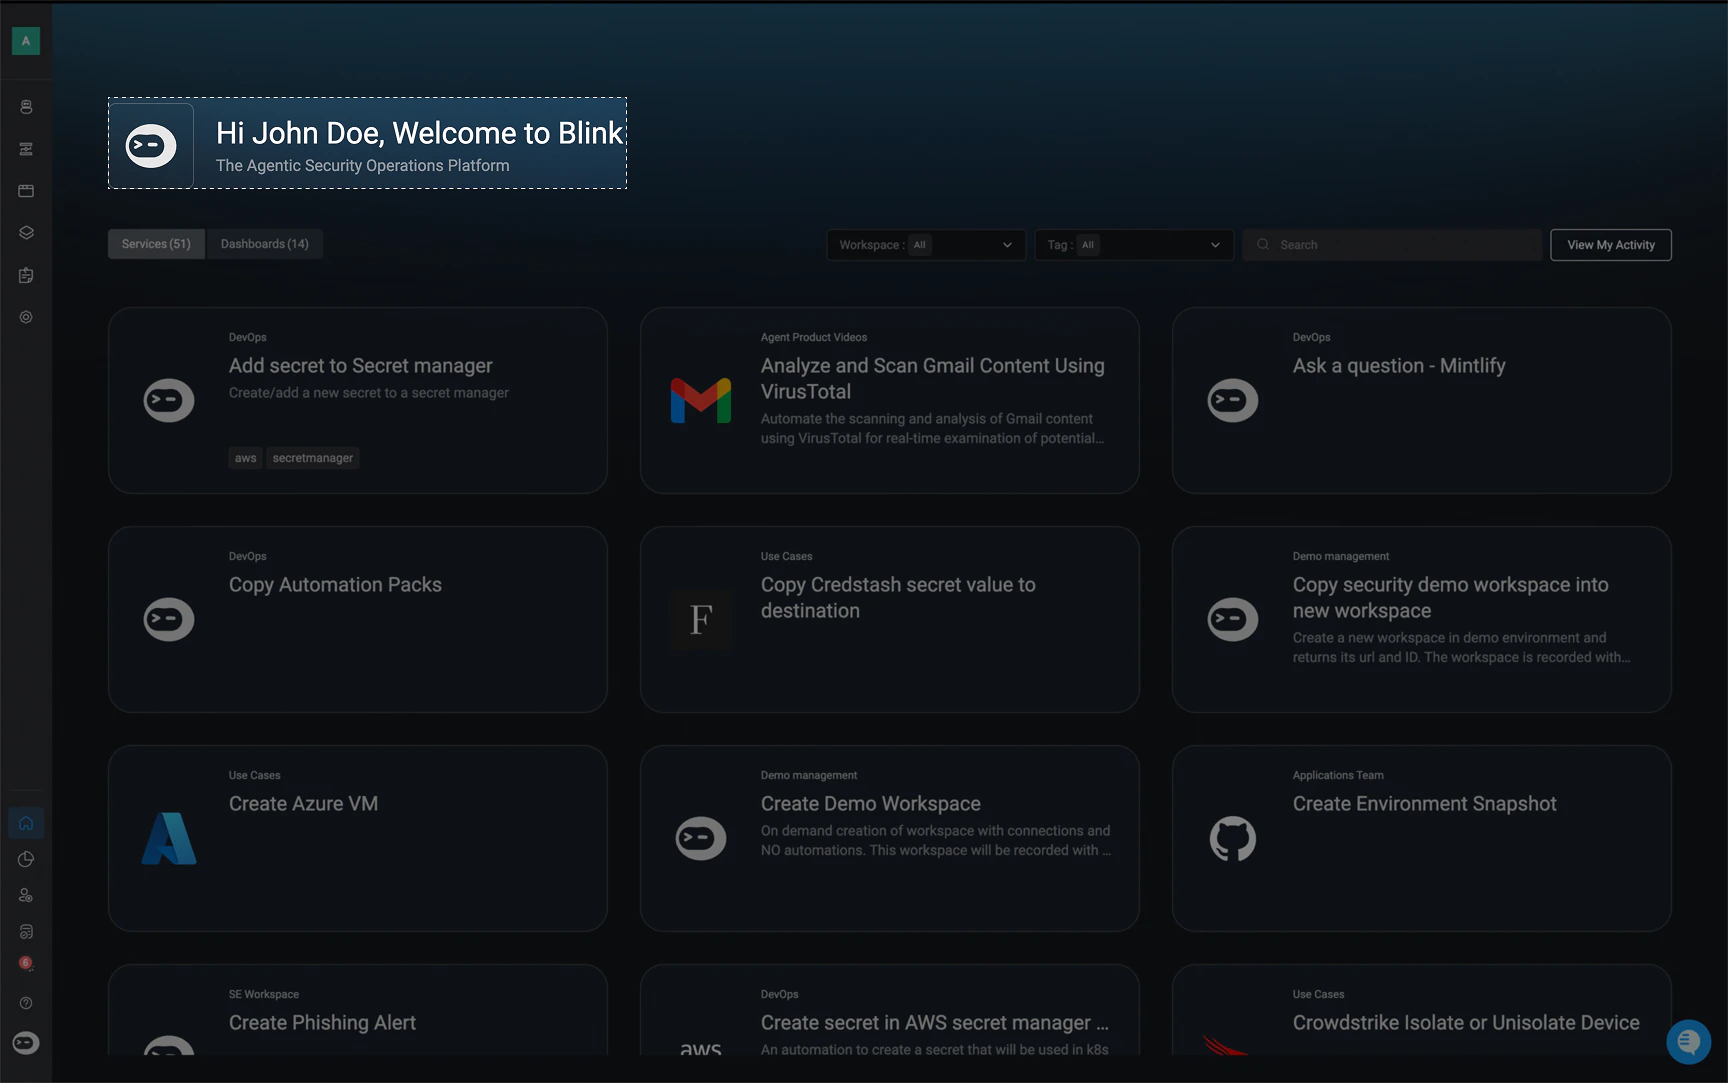 1. To customize your Blink Portals Logo and Header, navigate to your [General Settings](/docs/blink-platform/account-management/general)
2. Upload your custom logo and update the portal header as needed, then save your changes. Once saved, your updates will be automatically applied to the Blink Portal’s header and logo.
1. To customize your Blink Portals Logo and Header, navigate to your [General Settings](/docs/blink-platform/account-management/general)
2. Upload your custom logo and update the portal header as needed, then save your changes. Once saved, your updates will be automatically applied to the Blink Portal’s header and logo.
 ***
**The Blink Portal is separated into two separate tabs:**
For detailed guidance on Workflows, see our [Workflows Documentation](/docs/workflows/workflows).
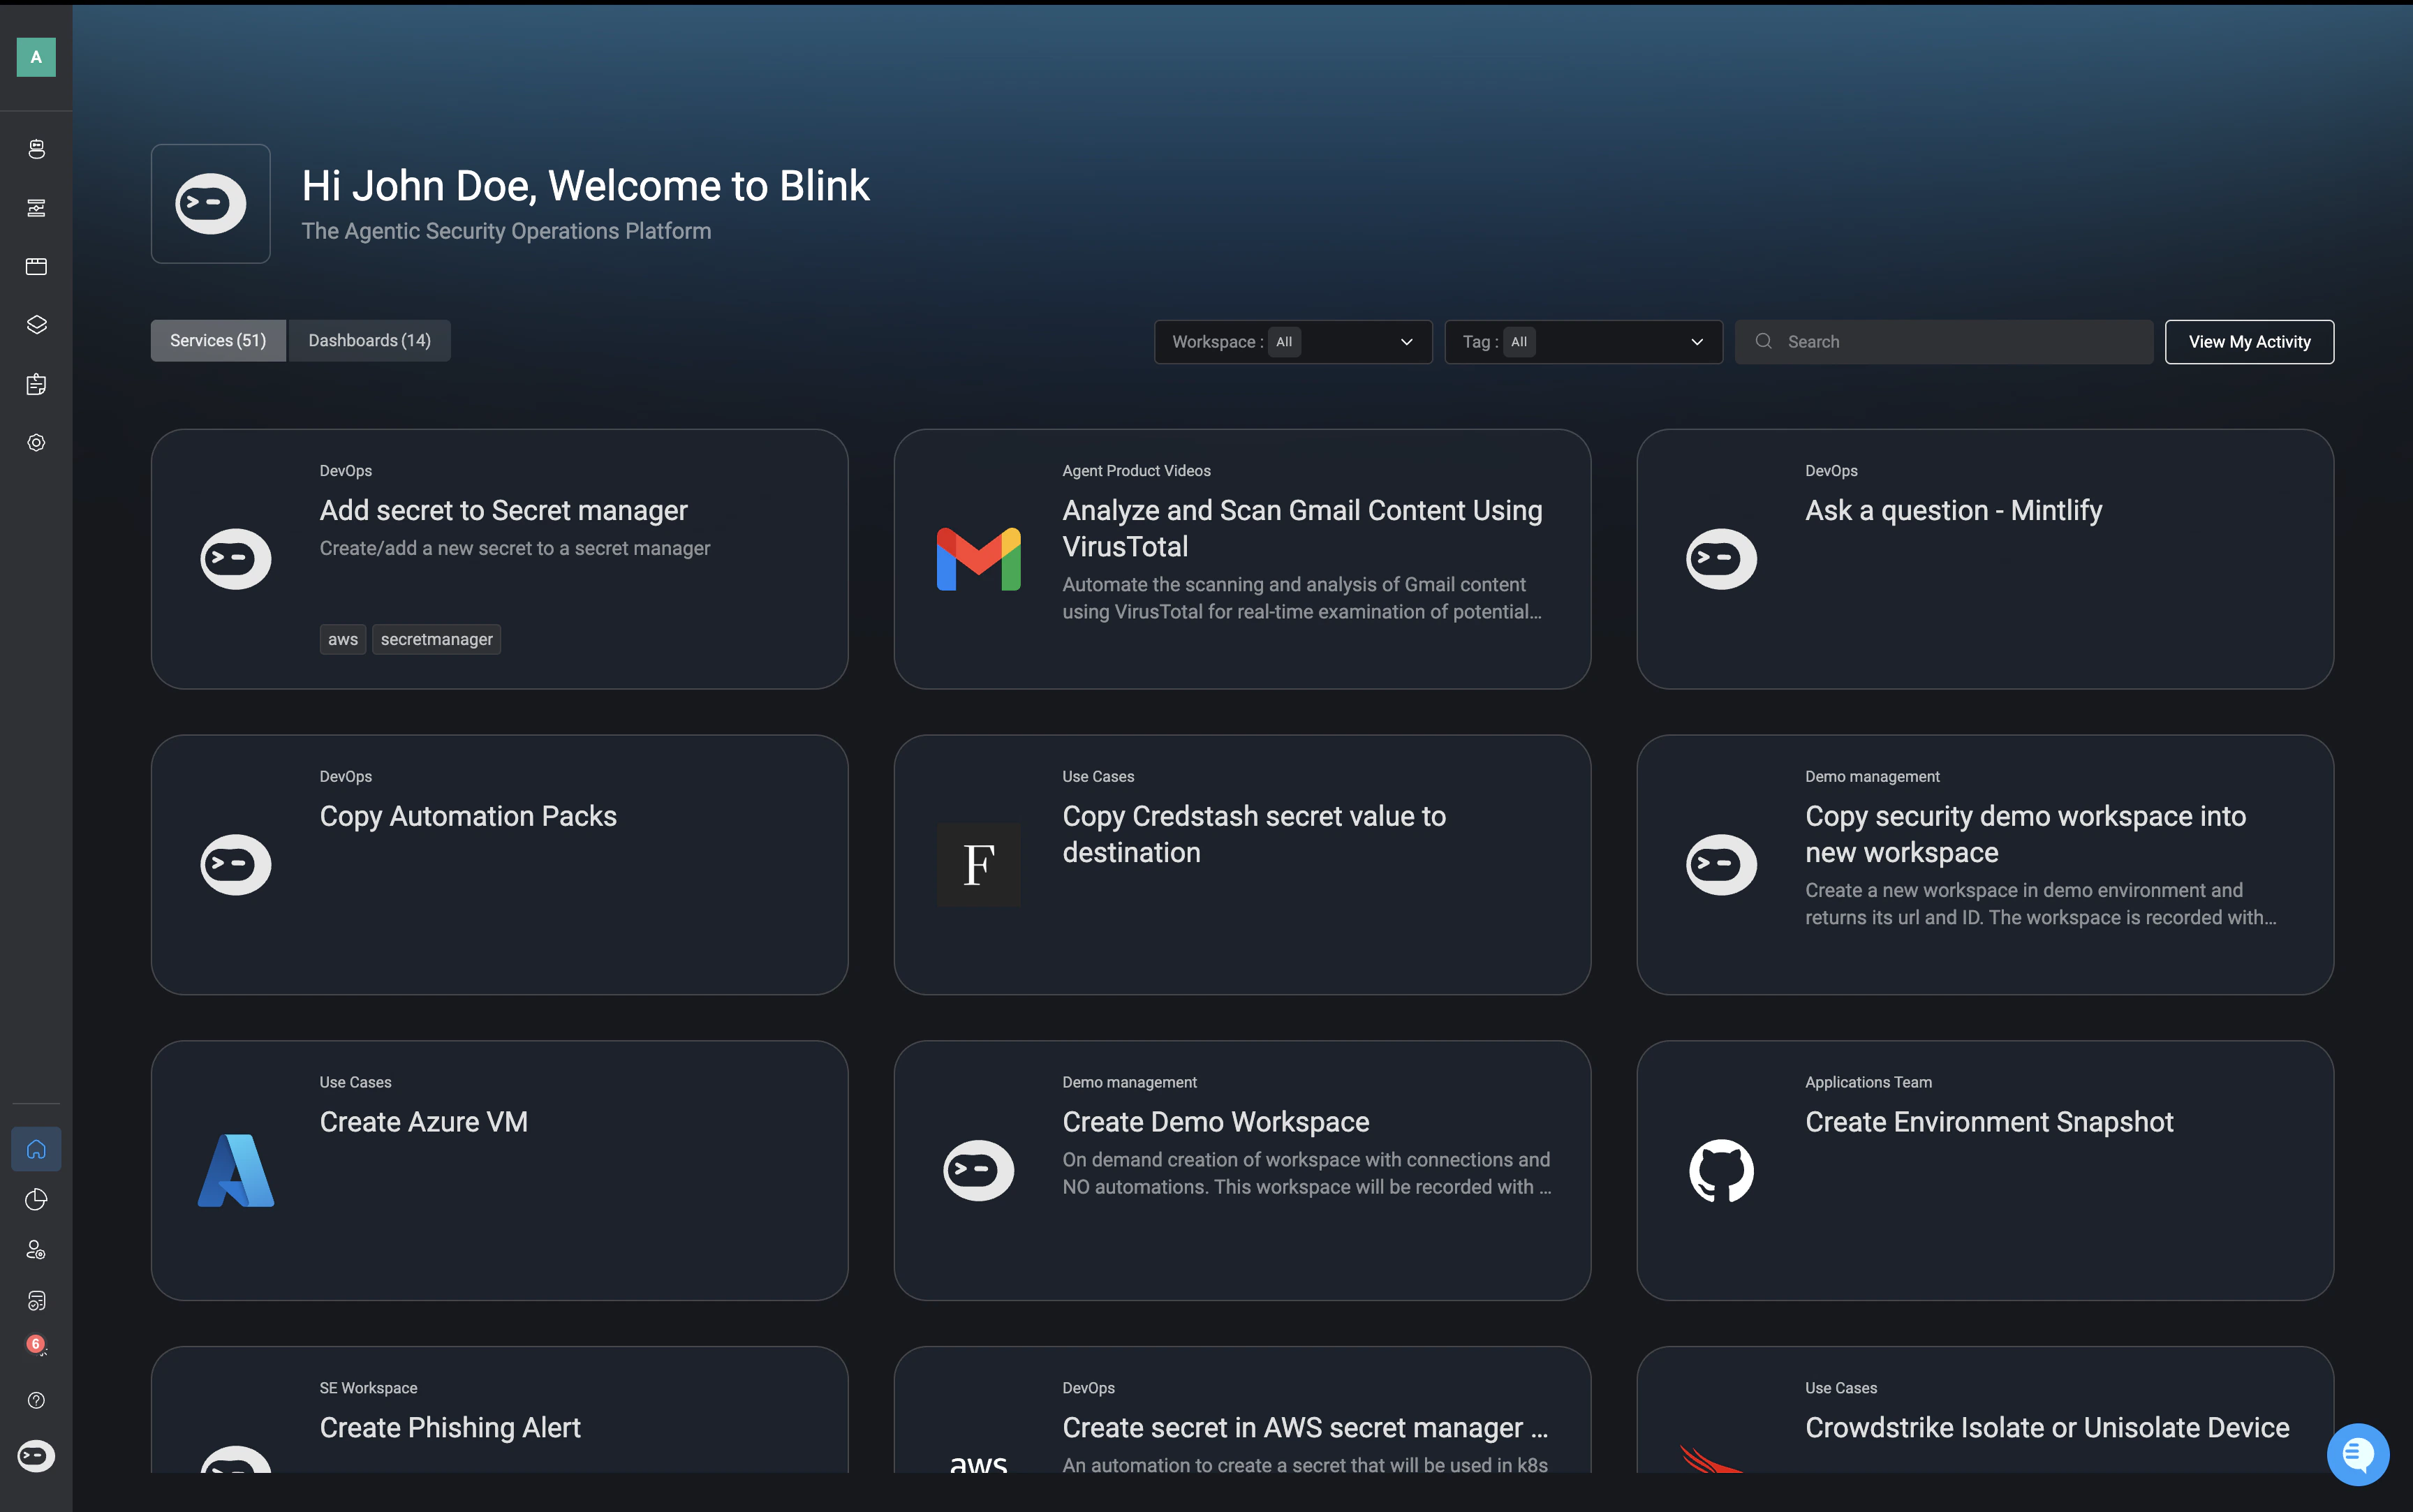
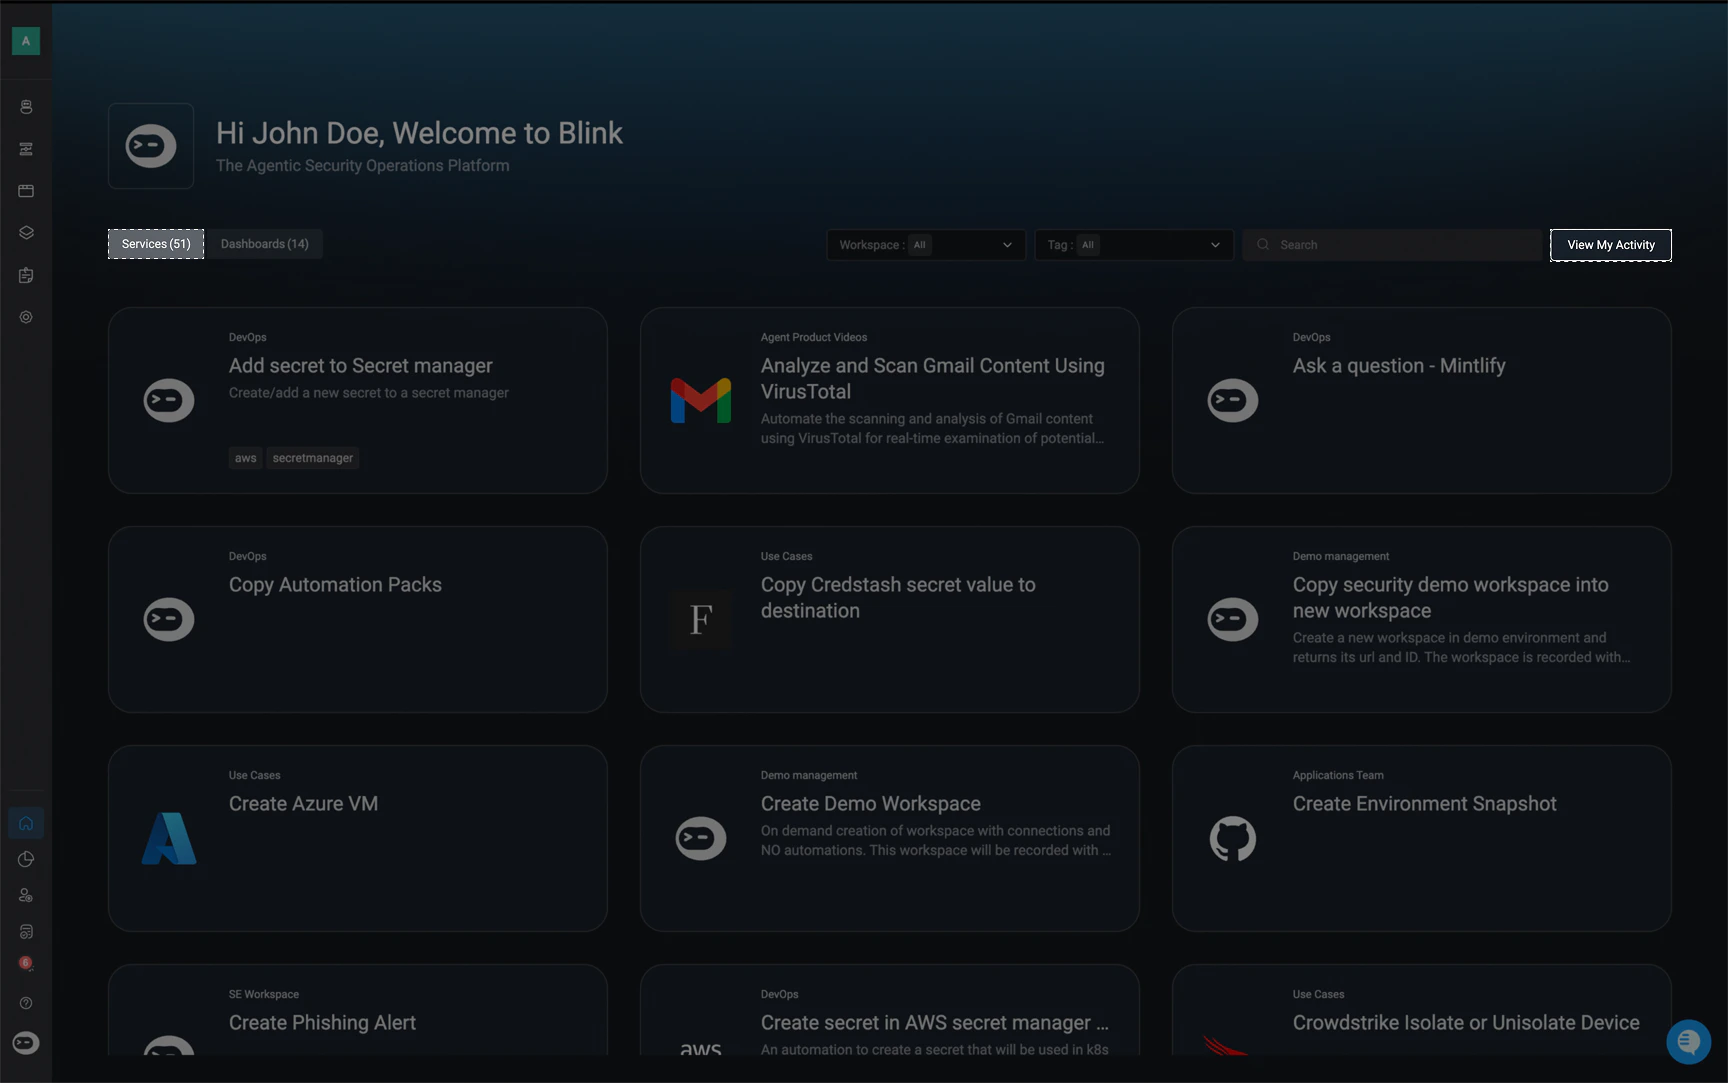
In the **Services** tab of the Blink Portal, you can access all **published** and **active** workflows available in your tenant:
* **Filter by workspace:** Narrow down workflows based on the workspace they belong to.
* **Filter by tags:** View workflows according to the tags assigned to them.
* **Search bar:** Quickly locate a specific workflow by name or keyword.
***
**The Blink Portal is separated into two separate tabs:**
For detailed guidance on Workflows, see our [Workflows Documentation](/docs/workflows/workflows).
In the **Services** tab of the Blink Portal, you can access all **published** and **active** workflows available in your tenant:
* **Filter by workspace:** Narrow down workflows based on the workspace they belong to.
* **Filter by tags:** View workflows according to the tags assigned to them.
* **Search bar:** Quickly locate a specific workflow by name or keyword.
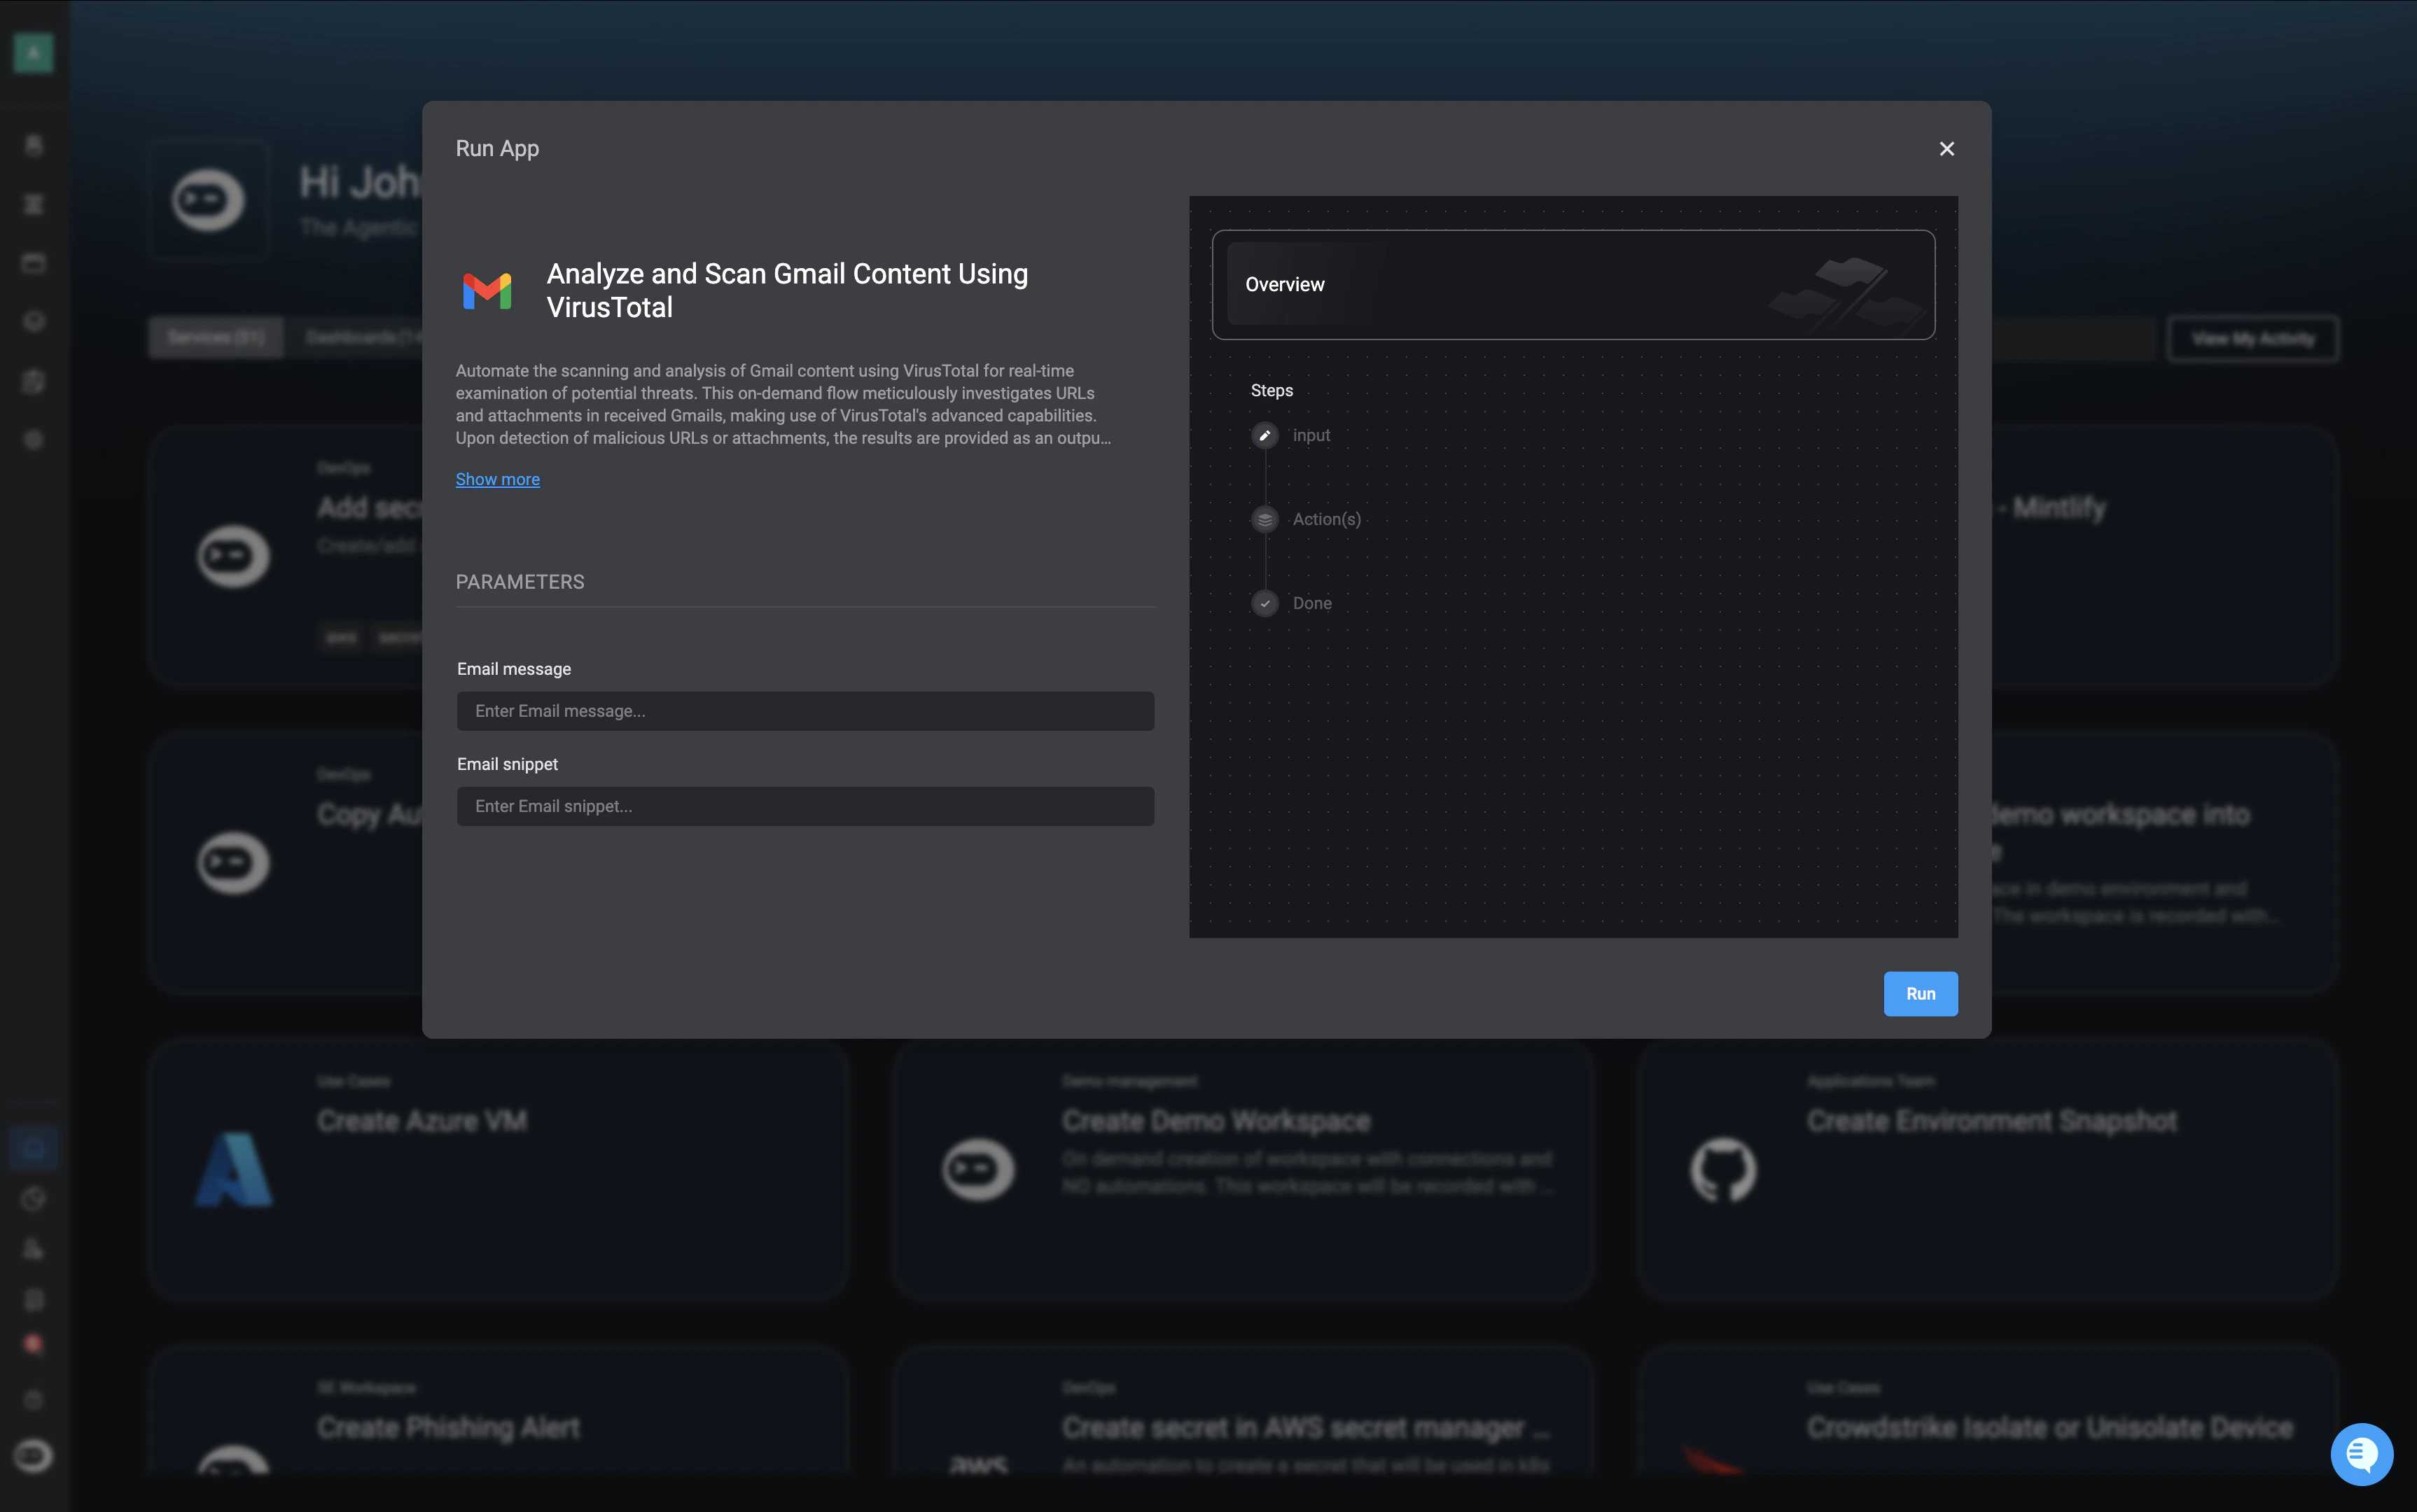
 Once you find the workflow you want, enter any required input parameters and the run the workflow.
 ***
## Blink Portal Activity
The Blink Portal makes it easy to review and monitor all workflow executions associated with your account.
To access your workflow activity history, open the **Services** tab and click **My Activity** in the upper-right corner.
***
## Blink Portal Activity
The Blink Portal makes it easy to review and monitor all workflow executions associated with your account.
To access your workflow activity history, open the **Services** tab and click **My Activity** in the upper-right corner.
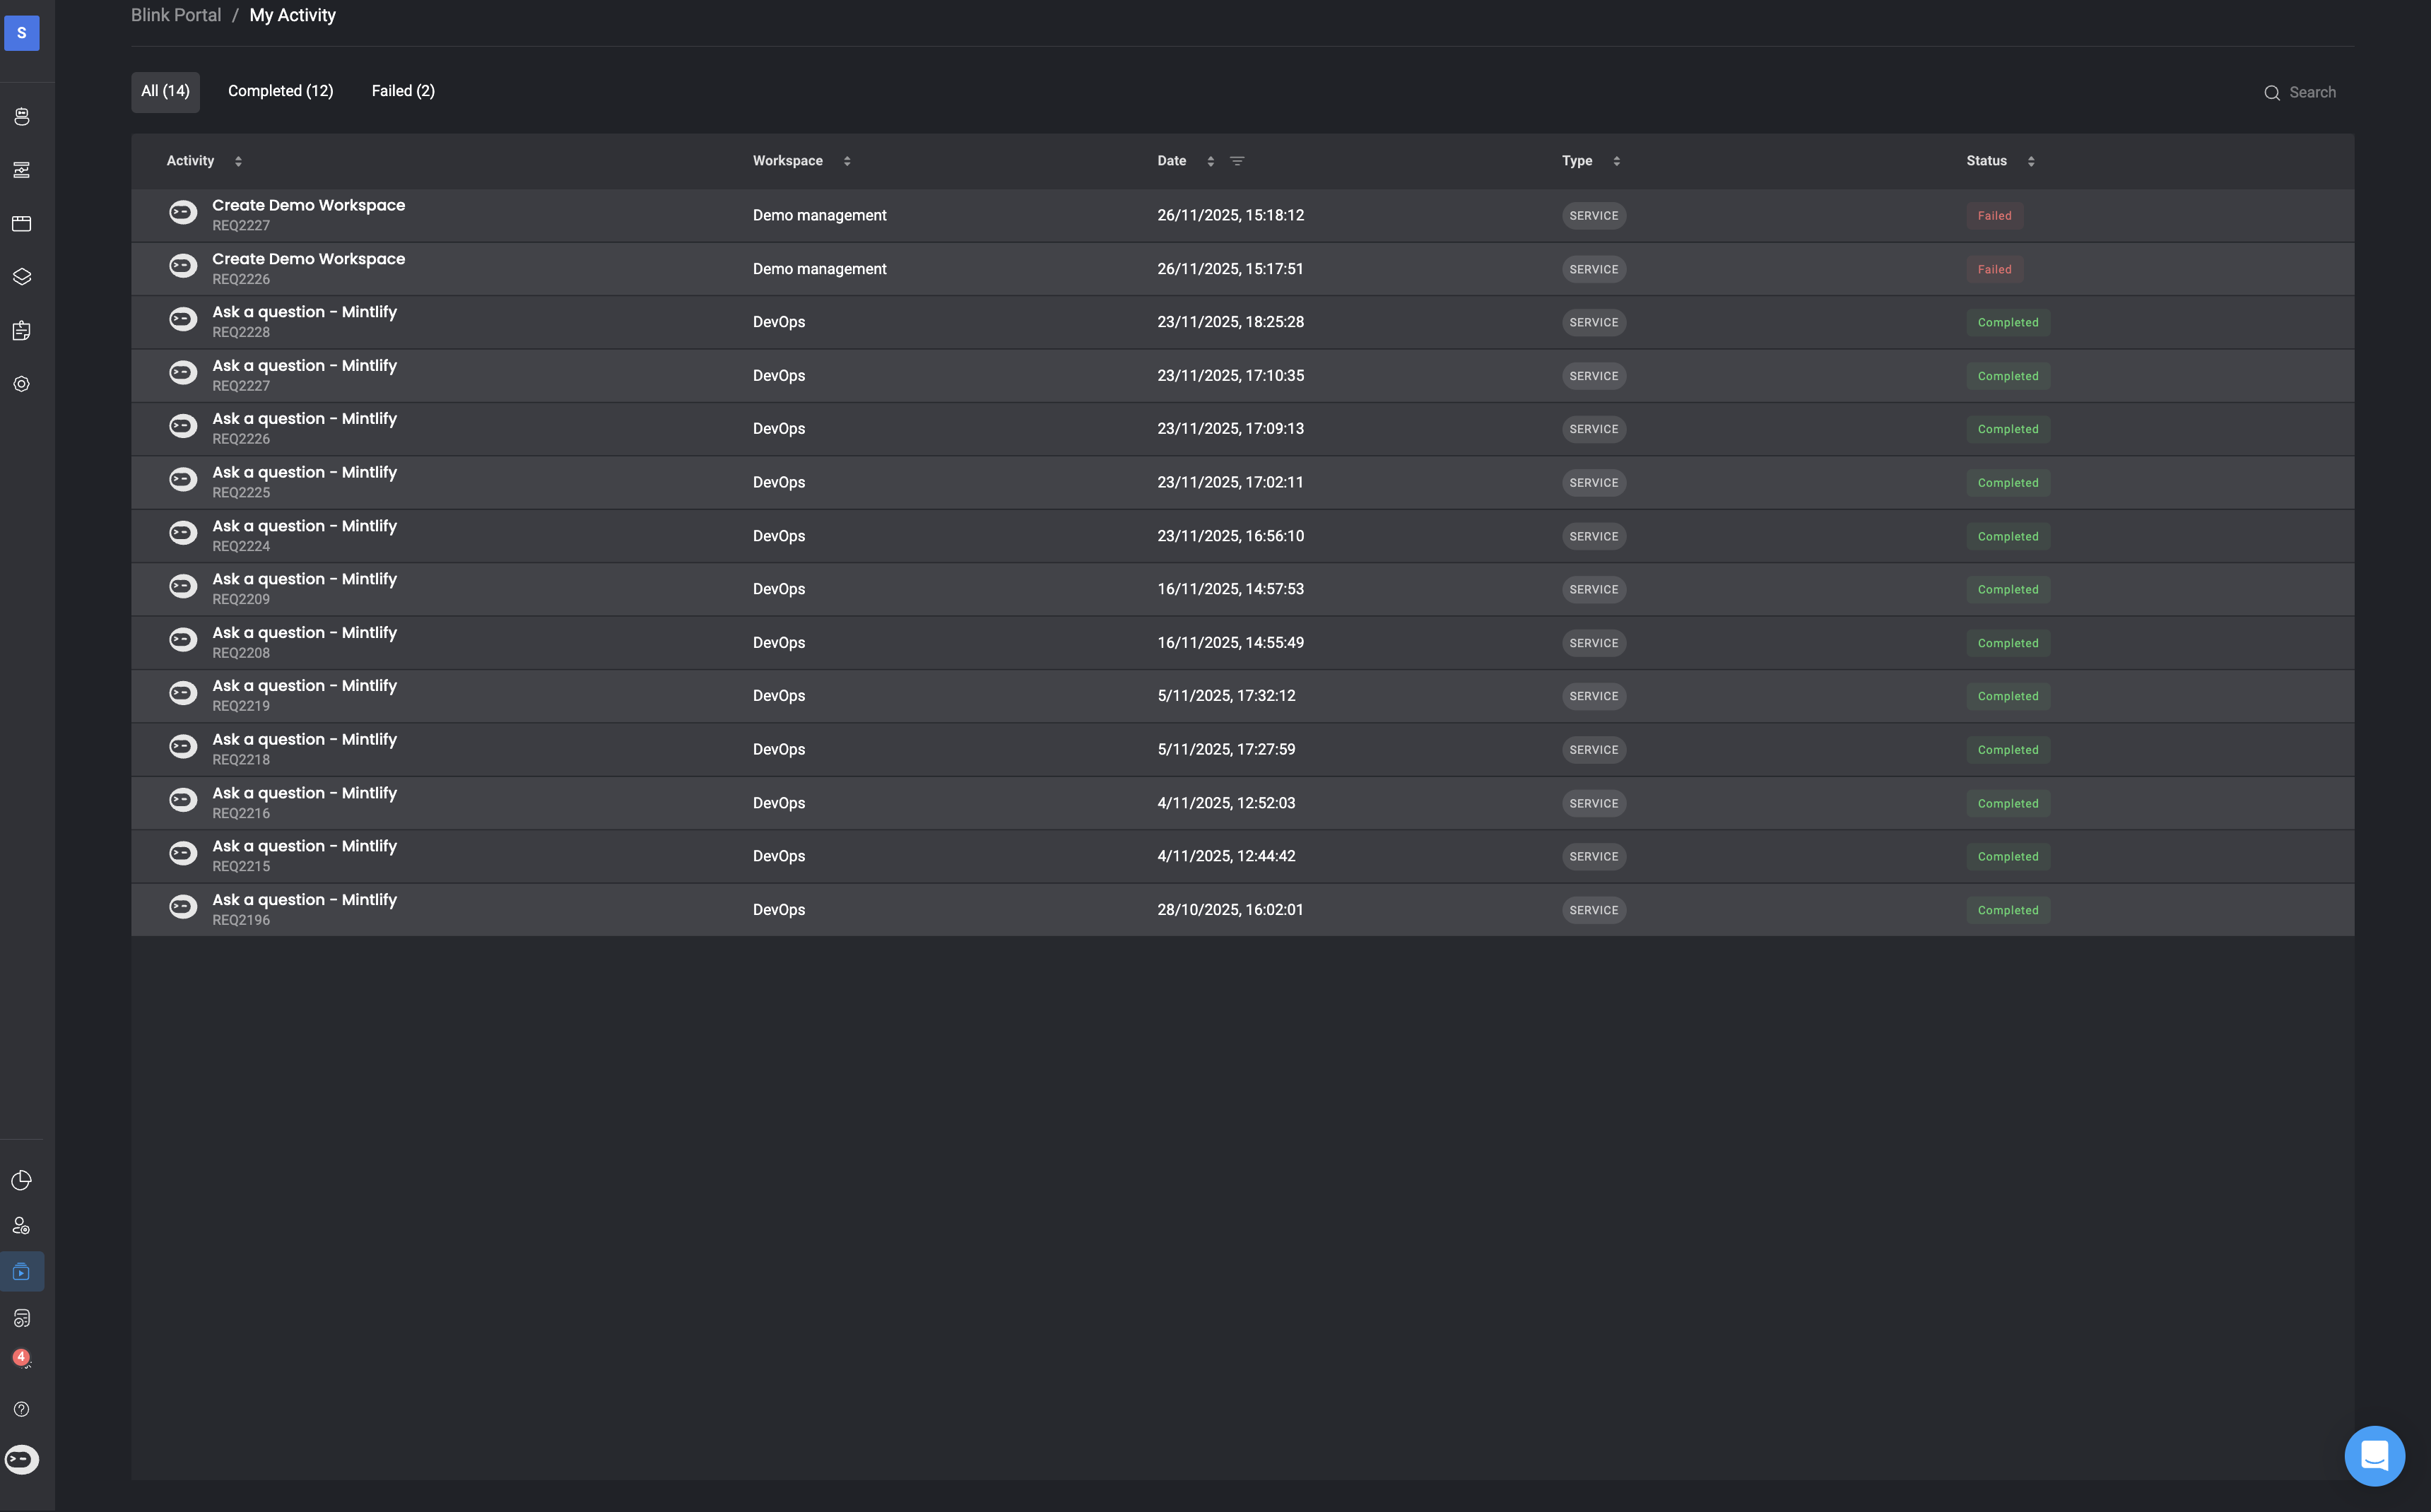
 A table of all your workflow executions, including their current status and key execution details. This allows you to quickly understand what ran, when it ran, and whether any action is required.
* You can filter the table to display all workflow executions, only workflows that failed during execution in the Blink Portal or only workflows that completed when executing in the workflow
* Next to the 'Date' field, you can select the to filter workflow executions according to a specified date and time
A table of all your workflow executions, including their current status and key execution details. This allows you to quickly understand what ran, when it ran, and whether any action is required.
* You can filter the table to display all workflow executions, only workflows that failed during execution in the Blink Portal or only workflows that completed when executing in the workflow
* Next to the 'Date' field, you can select the to filter workflow executions according to a specified date and time
 ***
## Share Workflows to the Blink Portal
In the [Workflow Overview](/docs/workflows/managing-workflows/workflow-overview-page) page, you can share and expose the selected workflow to the Blink Portal.
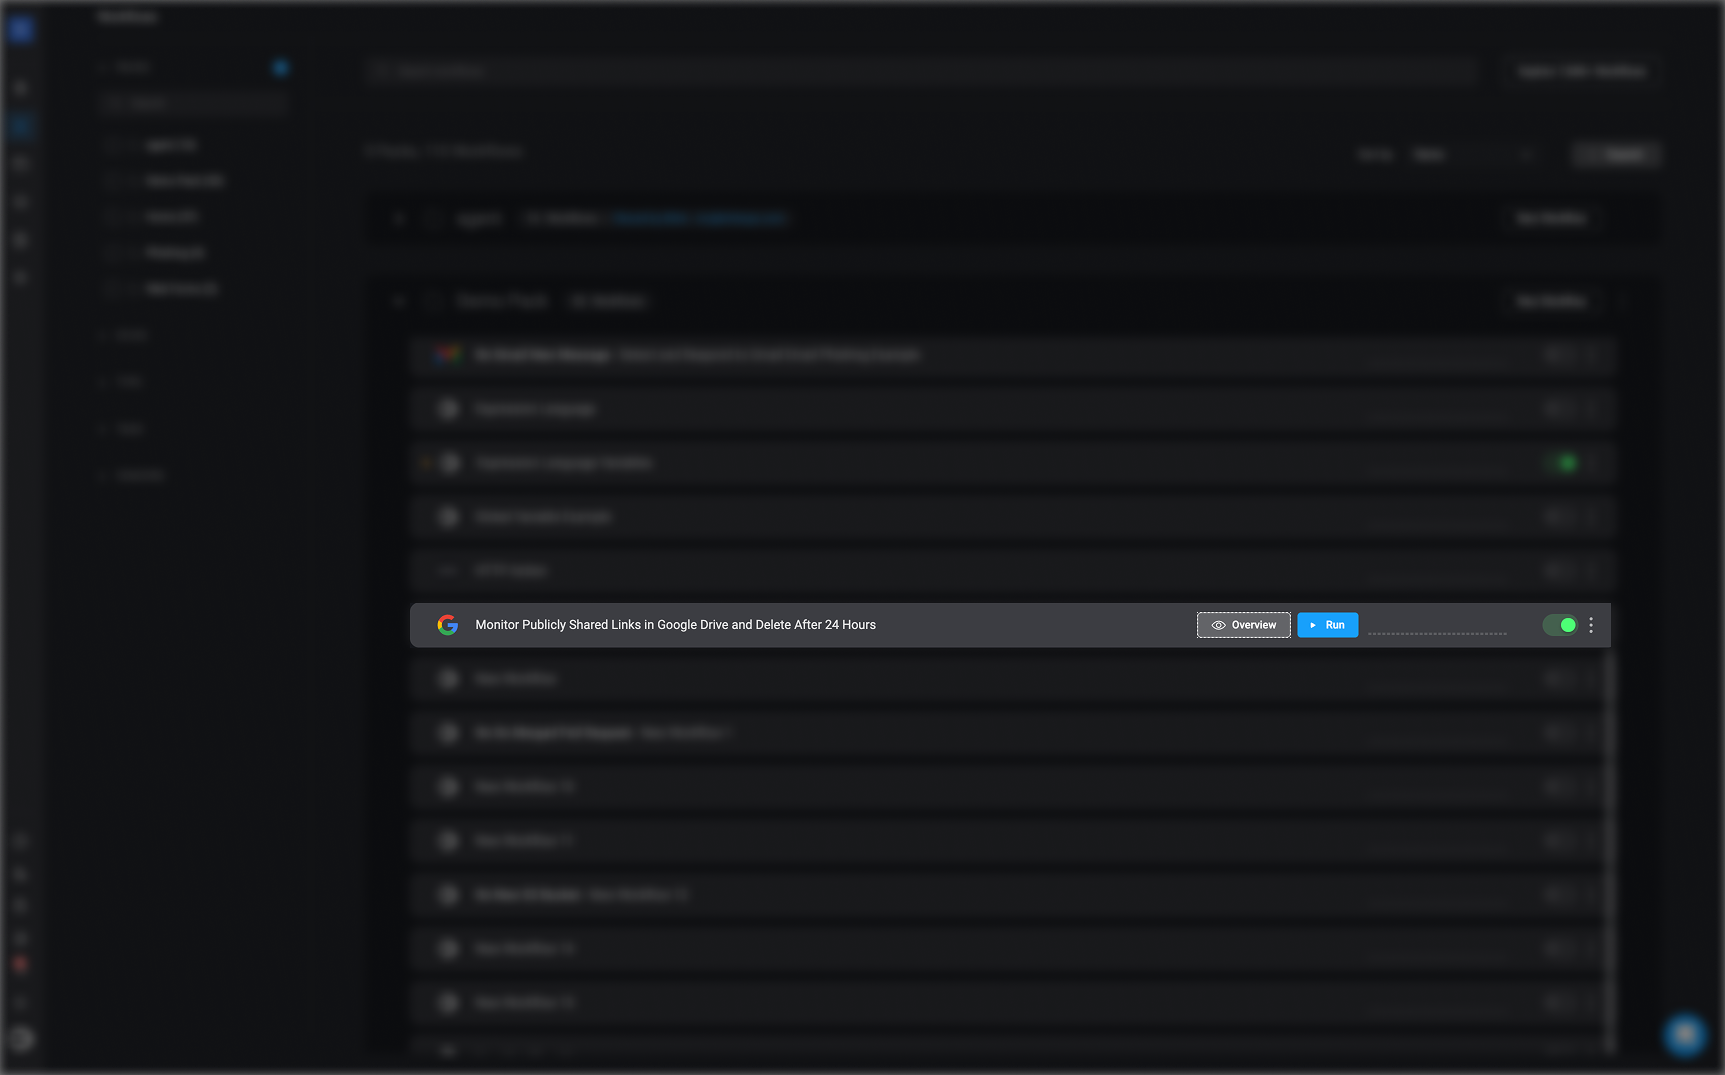
1. On the Workflow page, hover over the workflow you would like to expose to the Blink Portal and click on the "Overview" button.
***
## Share Workflows to the Blink Portal
In the [Workflow Overview](/docs/workflows/managing-workflows/workflow-overview-page) page, you can share and expose the selected workflow to the Blink Portal.
1. On the Workflow page, hover over the workflow you would like to expose to the Blink Portal and click on the "Overview" button.
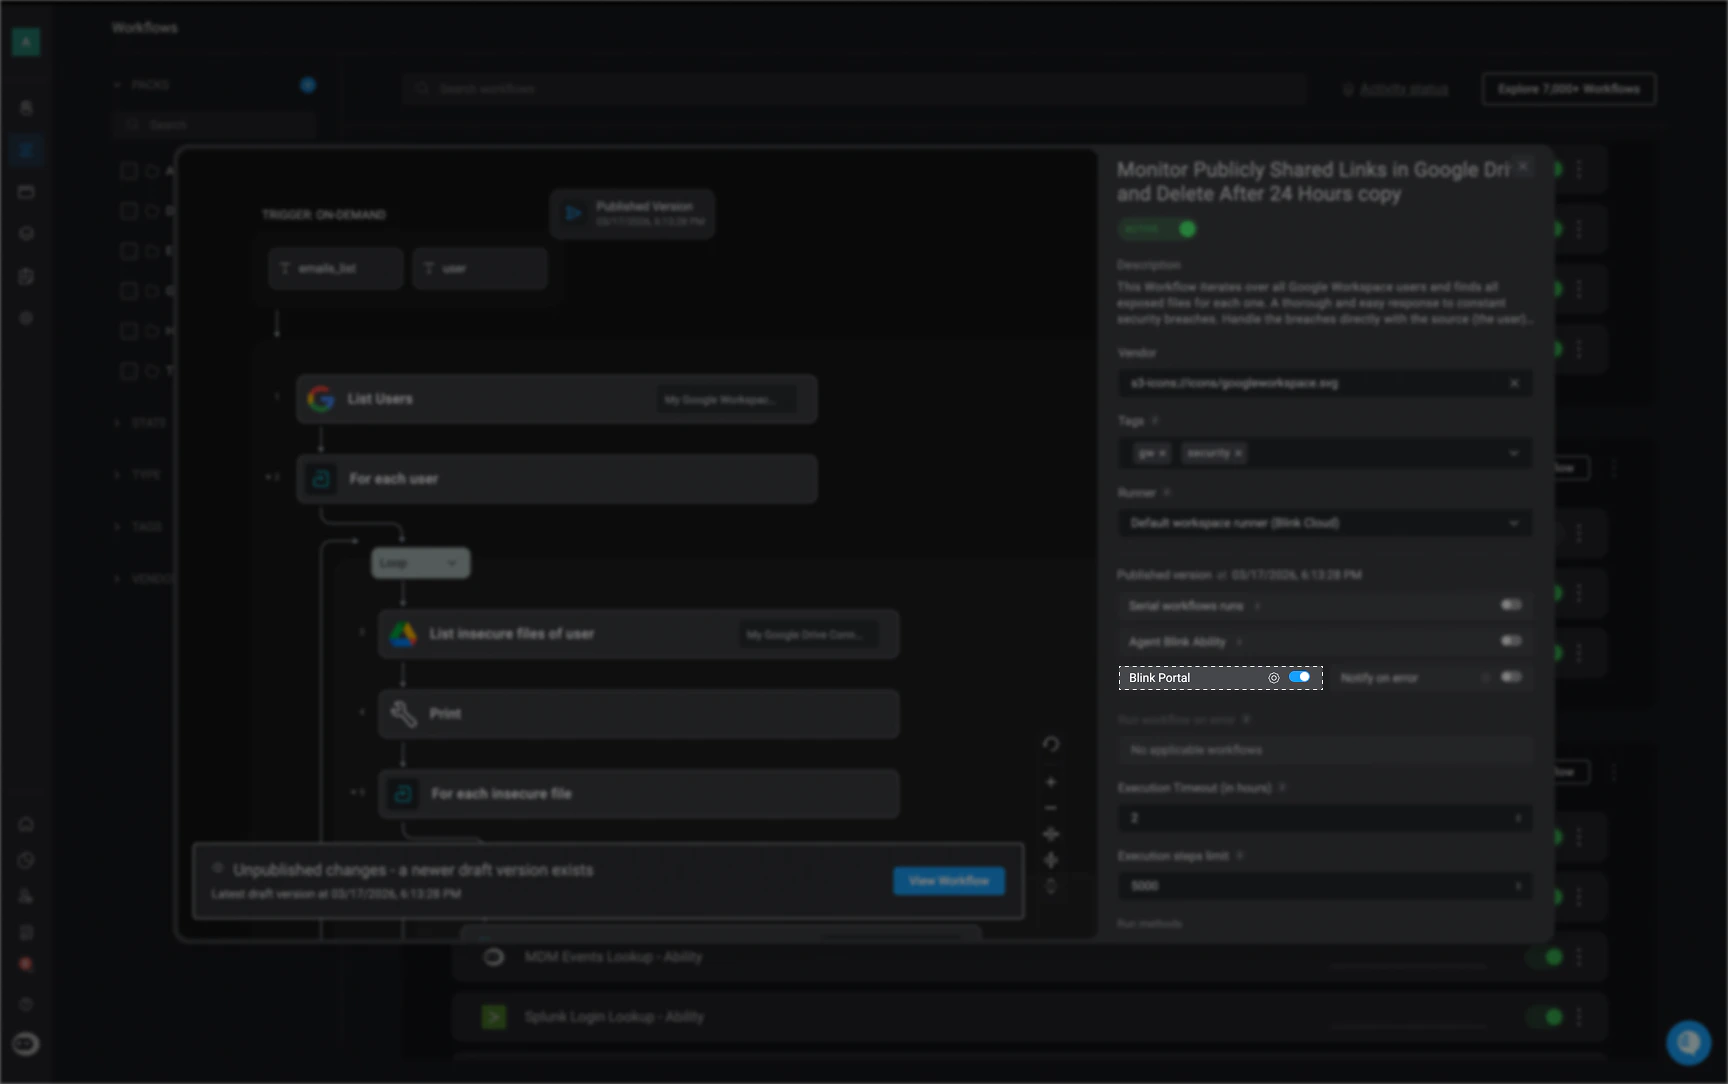
 2. Toggle the “Blink Portal” button to publish the selected workflow to the Blink Portal. Once enabled, the workflow becomes available for use in the portal.
If you disable this toggle, the workflow will be removed from the Blink Portal and will no longer be available to users.
2. Toggle the “Blink Portal” button to publish the selected workflow to the Blink Portal. Once enabled, the workflow becomes available for use in the portal.
If you disable this toggle, the workflow will be removed from the Blink Portal and will no longer be available to users.
 ***
## Service Settings in the Blink Portal
**Note**: These settings are only available to users with access to the workspace the selected service is part of.
To access the Blink Portal's settings, click the menu and choose from the following options:
1. **Manage Portal Access**- Enter the email address of a user(s) or group(s) within your tenant to share the selected workflow in the Blink Portal.
2. **Navigate to the selected workflow**- Navigate directly to the workflow you have selected in the Blink Portal.
3. Navigate to the **workspace** where the selected workflow is located.
***
## Service Settings in the Blink Portal
**Note**: These settings are only available to users with access to the workspace the selected service is part of.
To access the Blink Portal's settings, click the menu and choose from the following options:
1. **Manage Portal Access**- Enter the email address of a user(s) or group(s) within your tenant to share the selected workflow in the Blink Portal.
2. **Navigate to the selected workflow**- Navigate directly to the workflow you have selected in the Blink Portal.
3. Navigate to the **workspace** where the selected workflow is located.
 # Dashboards
For detailed guidance on Dashboards, see [Dashboards Documentation](/docs/blink-platform/dashboards/dashboards).
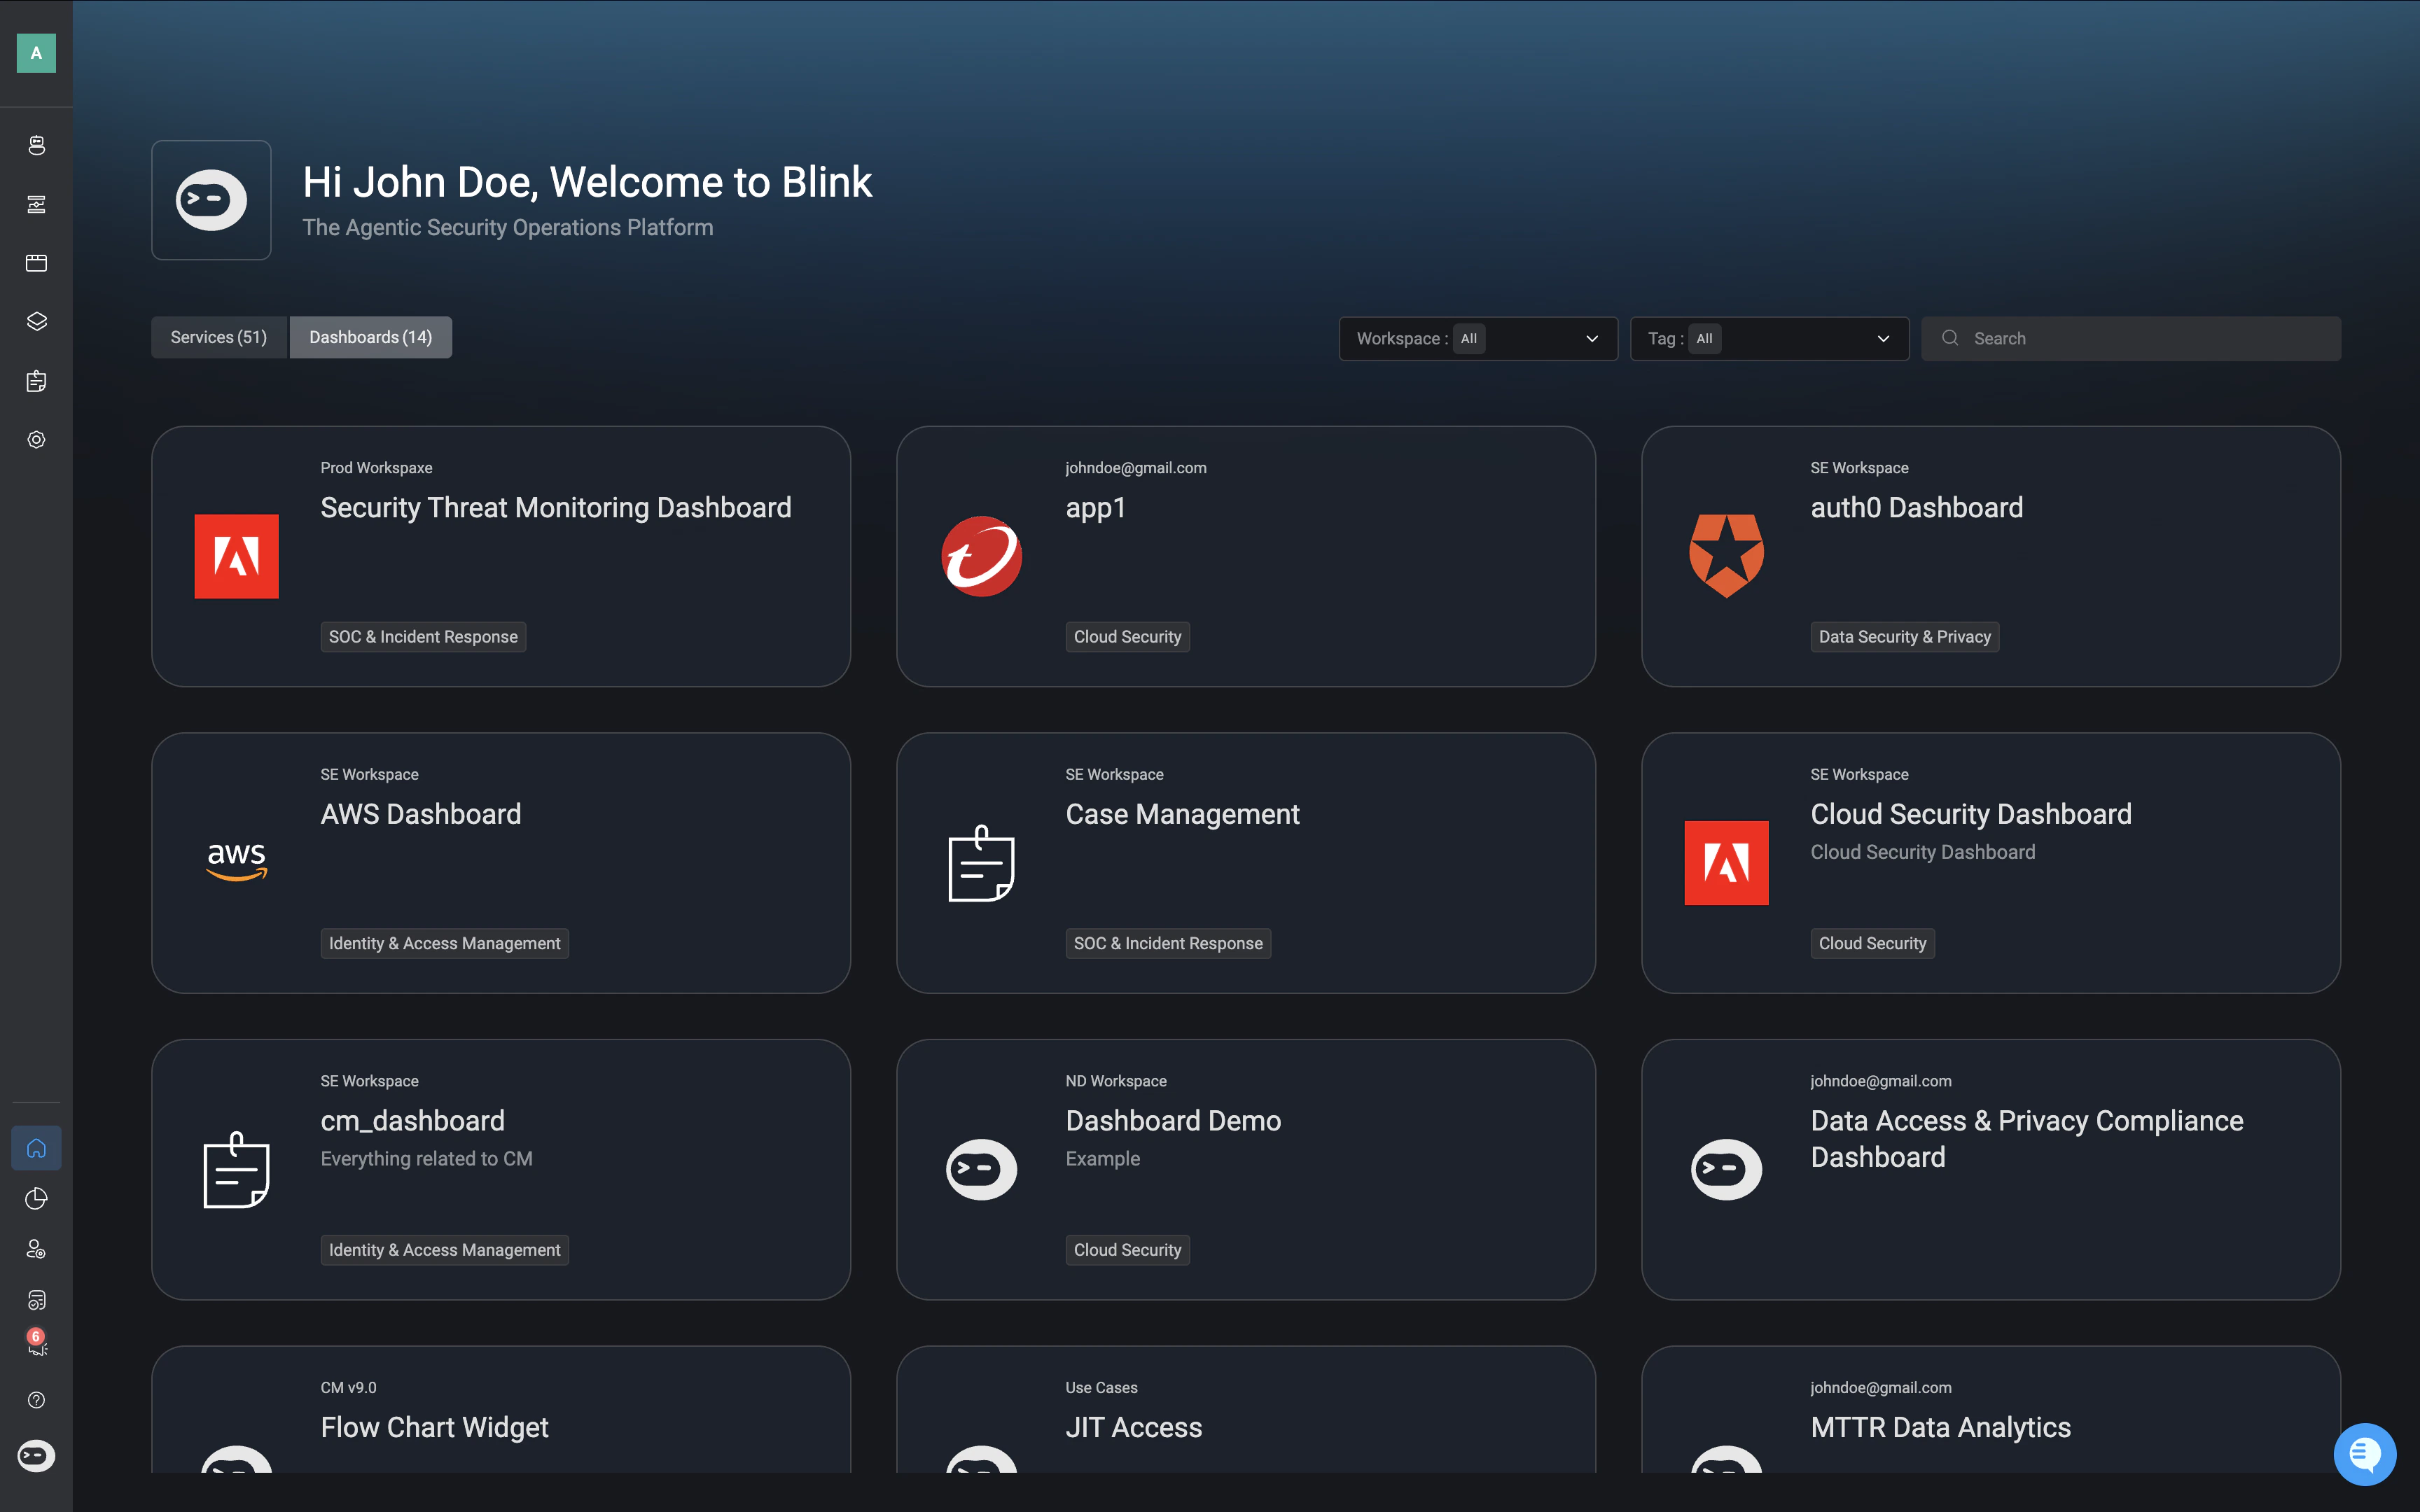
In the **Dashboard** tab of the Blink Portal, you can access all dashboards you have shared to the Blink Portal
* **Filter by workspace:** Narrow down dashboards based on the workspace they belong to.
* **Filter by tags:** View dashboards according to the tags assigned to them.
* **Search bar:** Quickly locate a specific dashboard by name or keyword.
# Dashboards
For detailed guidance on Dashboards, see [Dashboards Documentation](/docs/blink-platform/dashboards/dashboards).
In the **Dashboard** tab of the Blink Portal, you can access all dashboards you have shared to the Blink Portal
* **Filter by workspace:** Narrow down dashboards based on the workspace they belong to.
* **Filter by tags:** View dashboards according to the tags assigned to them.
* **Search bar:** Quickly locate a specific dashboard by name or keyword.
 ***
## View Dashboard in the Blink Portal
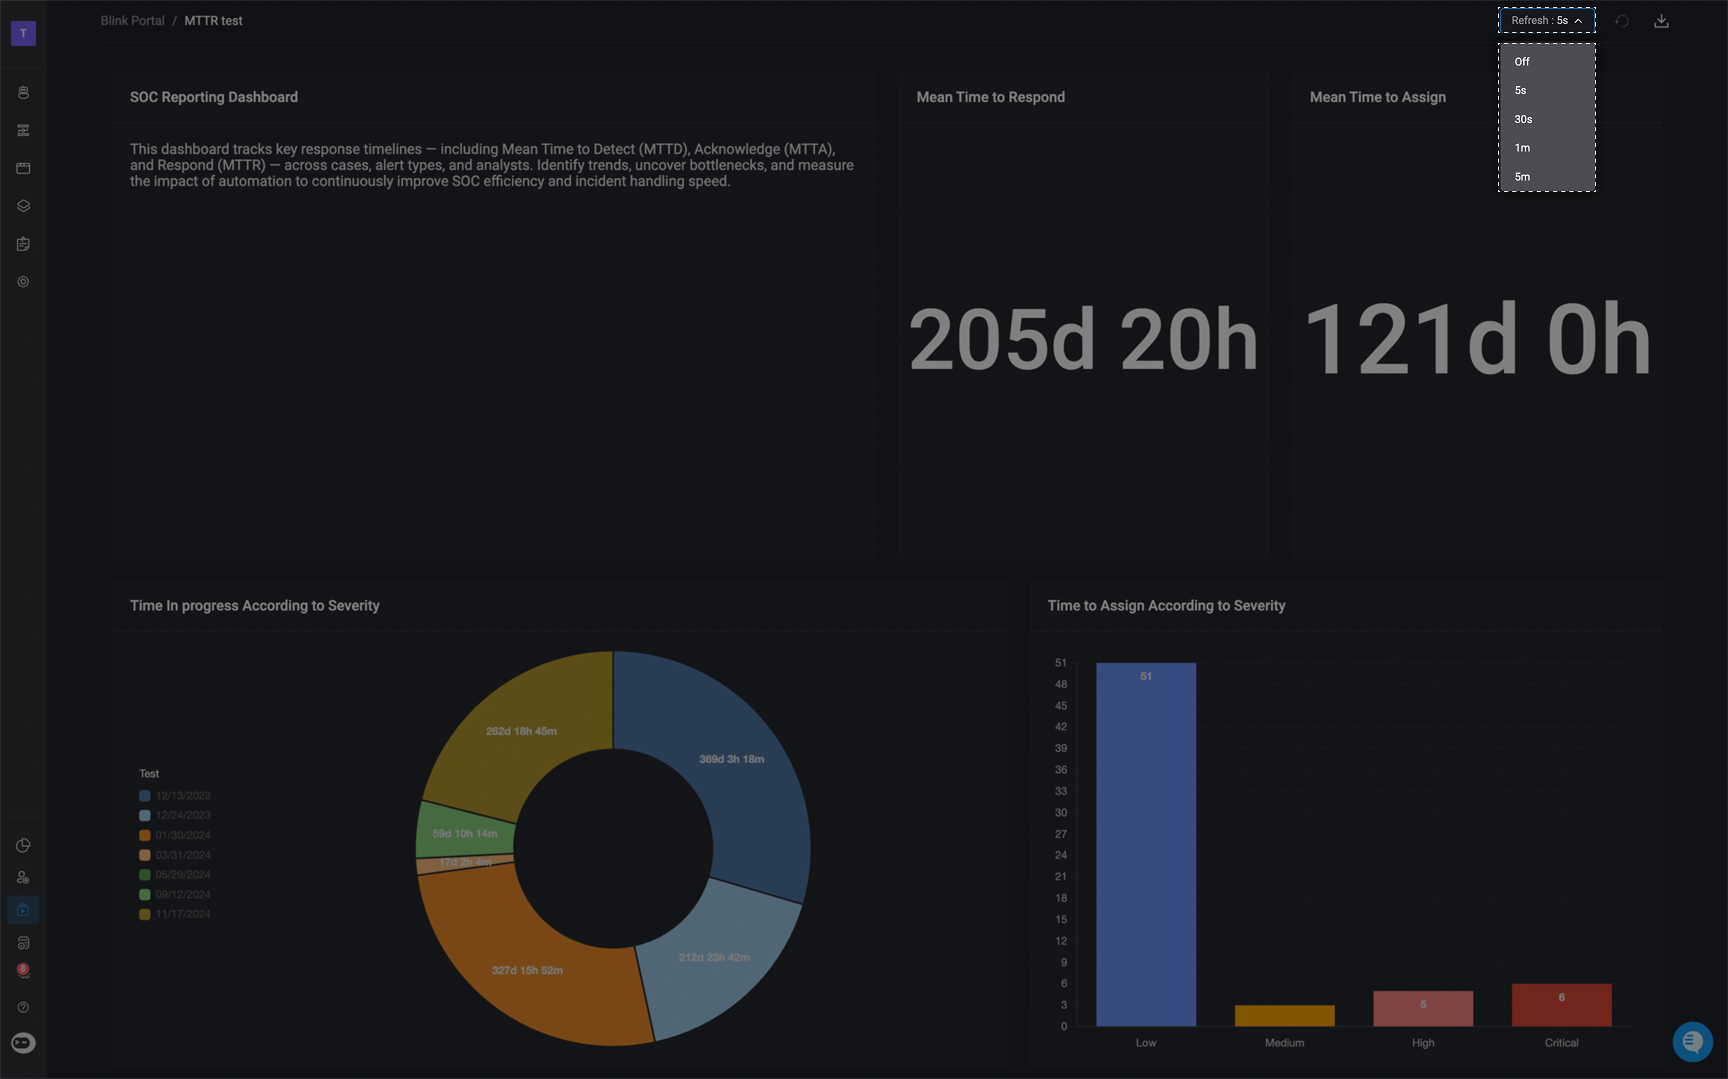
Select a 'Dashboard' to open it in the Blink Portal. In the top-right corner, you can configure the auto-refresh interval to control how often the dashboard updates and reflects the most recent data.
By default, the dashboard refreshes **every 5 minutes**.
Available refresh intervals:
* Off (manual refresh only- )
* 5 seconds
* 30 seconds
* 1 minute
* 5 minutes (default)
* 15 minutes
* 30 minutes
* 1 hour
Adjust the refresh setting based on how frequently you want the data to update.
***
## View Dashboard in the Blink Portal
Select a 'Dashboard' to open it in the Blink Portal. In the top-right corner, you can configure the auto-refresh interval to control how often the dashboard updates and reflects the most recent data.
By default, the dashboard refreshes **every 5 minutes**.
Available refresh intervals:
* Off (manual refresh only- )
* 5 seconds
* 30 seconds
* 1 minute
* 5 minutes (default)
* 15 minutes
* 30 minutes
* 1 hour
Adjust the refresh setting based on how frequently you want the data to update.
 ***
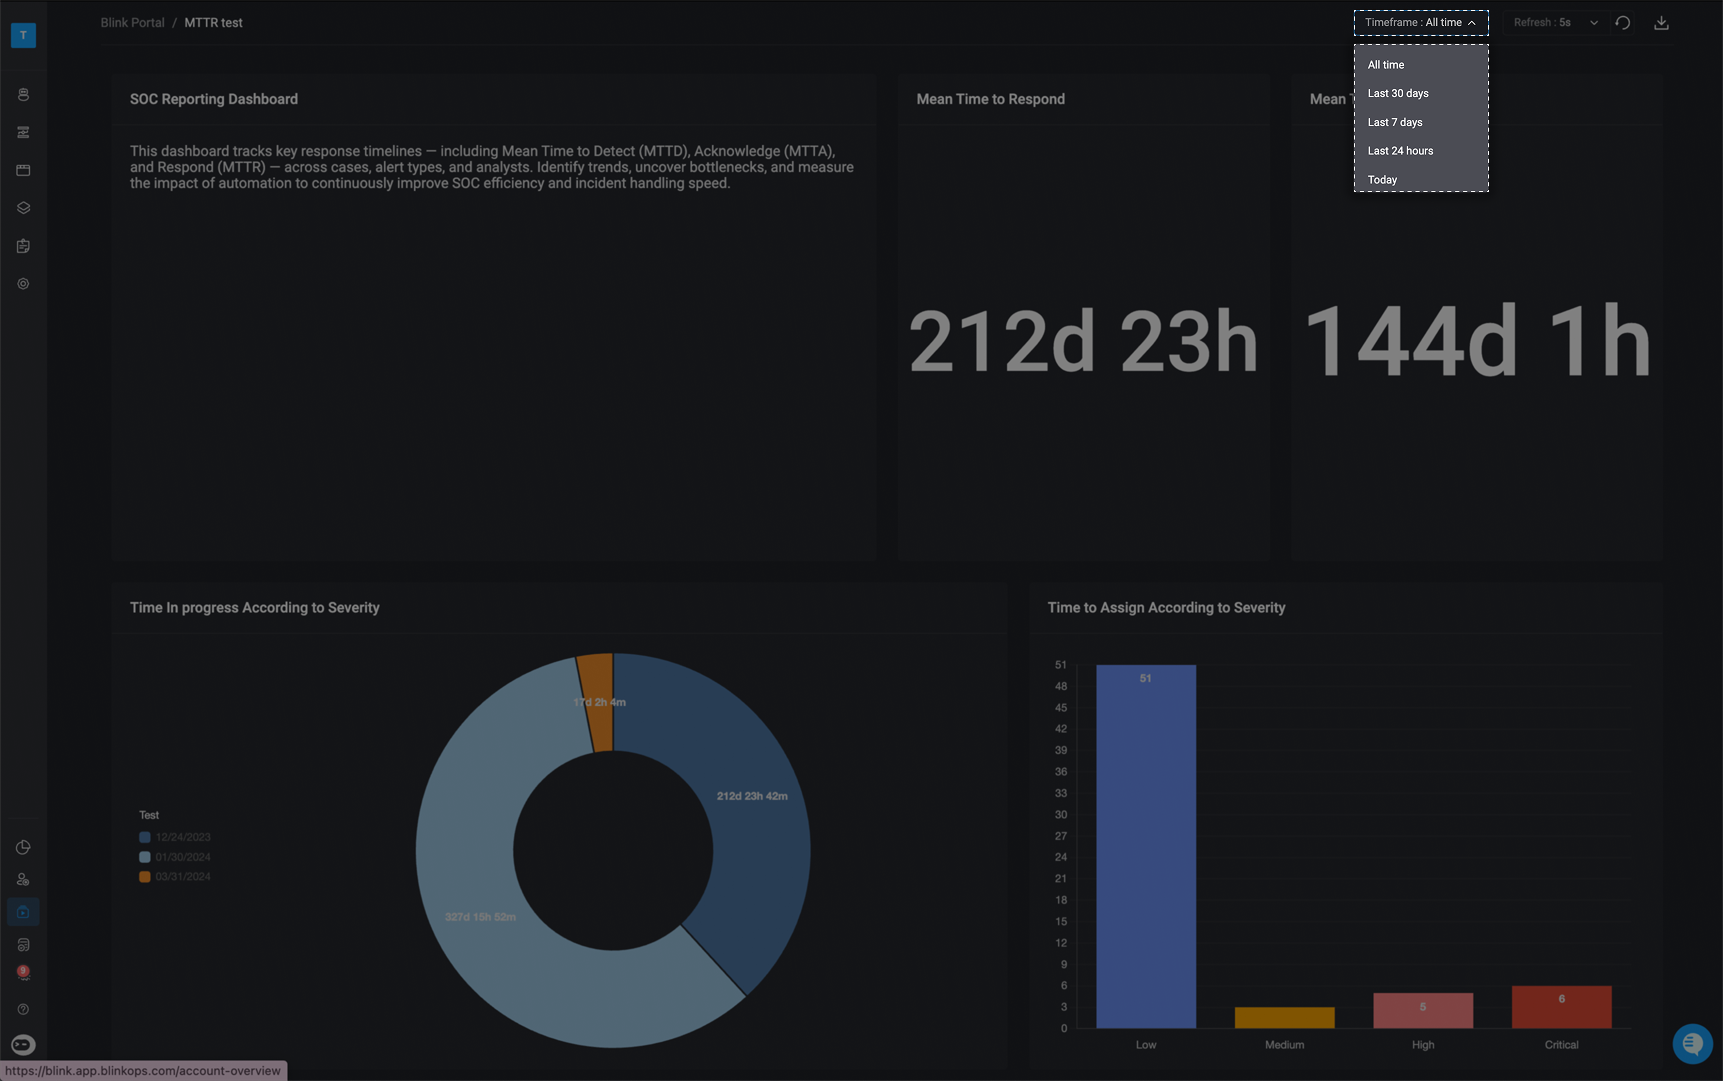
You can also select a **timeframe**, which acts as a **global filter** across the dashboard. This allows you to view only the data created within a specific time window—for example, all cases created in the last 7 days.
**Note:** This filter applies only to widgets whose data source includes the `created_at` field.
The available timeframes are:
* **Today**
* **Last 24 hours** *(default)*
* **Last 7 days**
* **Last 30 days**
***
You can also select a **timeframe**, which acts as a **global filter** across the dashboard. This allows you to view only the data created within a specific time window—for example, all cases created in the last 7 days.
**Note:** This filter applies only to widgets whose data source includes the `created_at` field.
The available timeframes are:
* **Today**
* **Last 24 hours** *(default)*
* **Last 7 days**
* **Last 30 days**
 ***
## Dashboard Widget's Expanded View
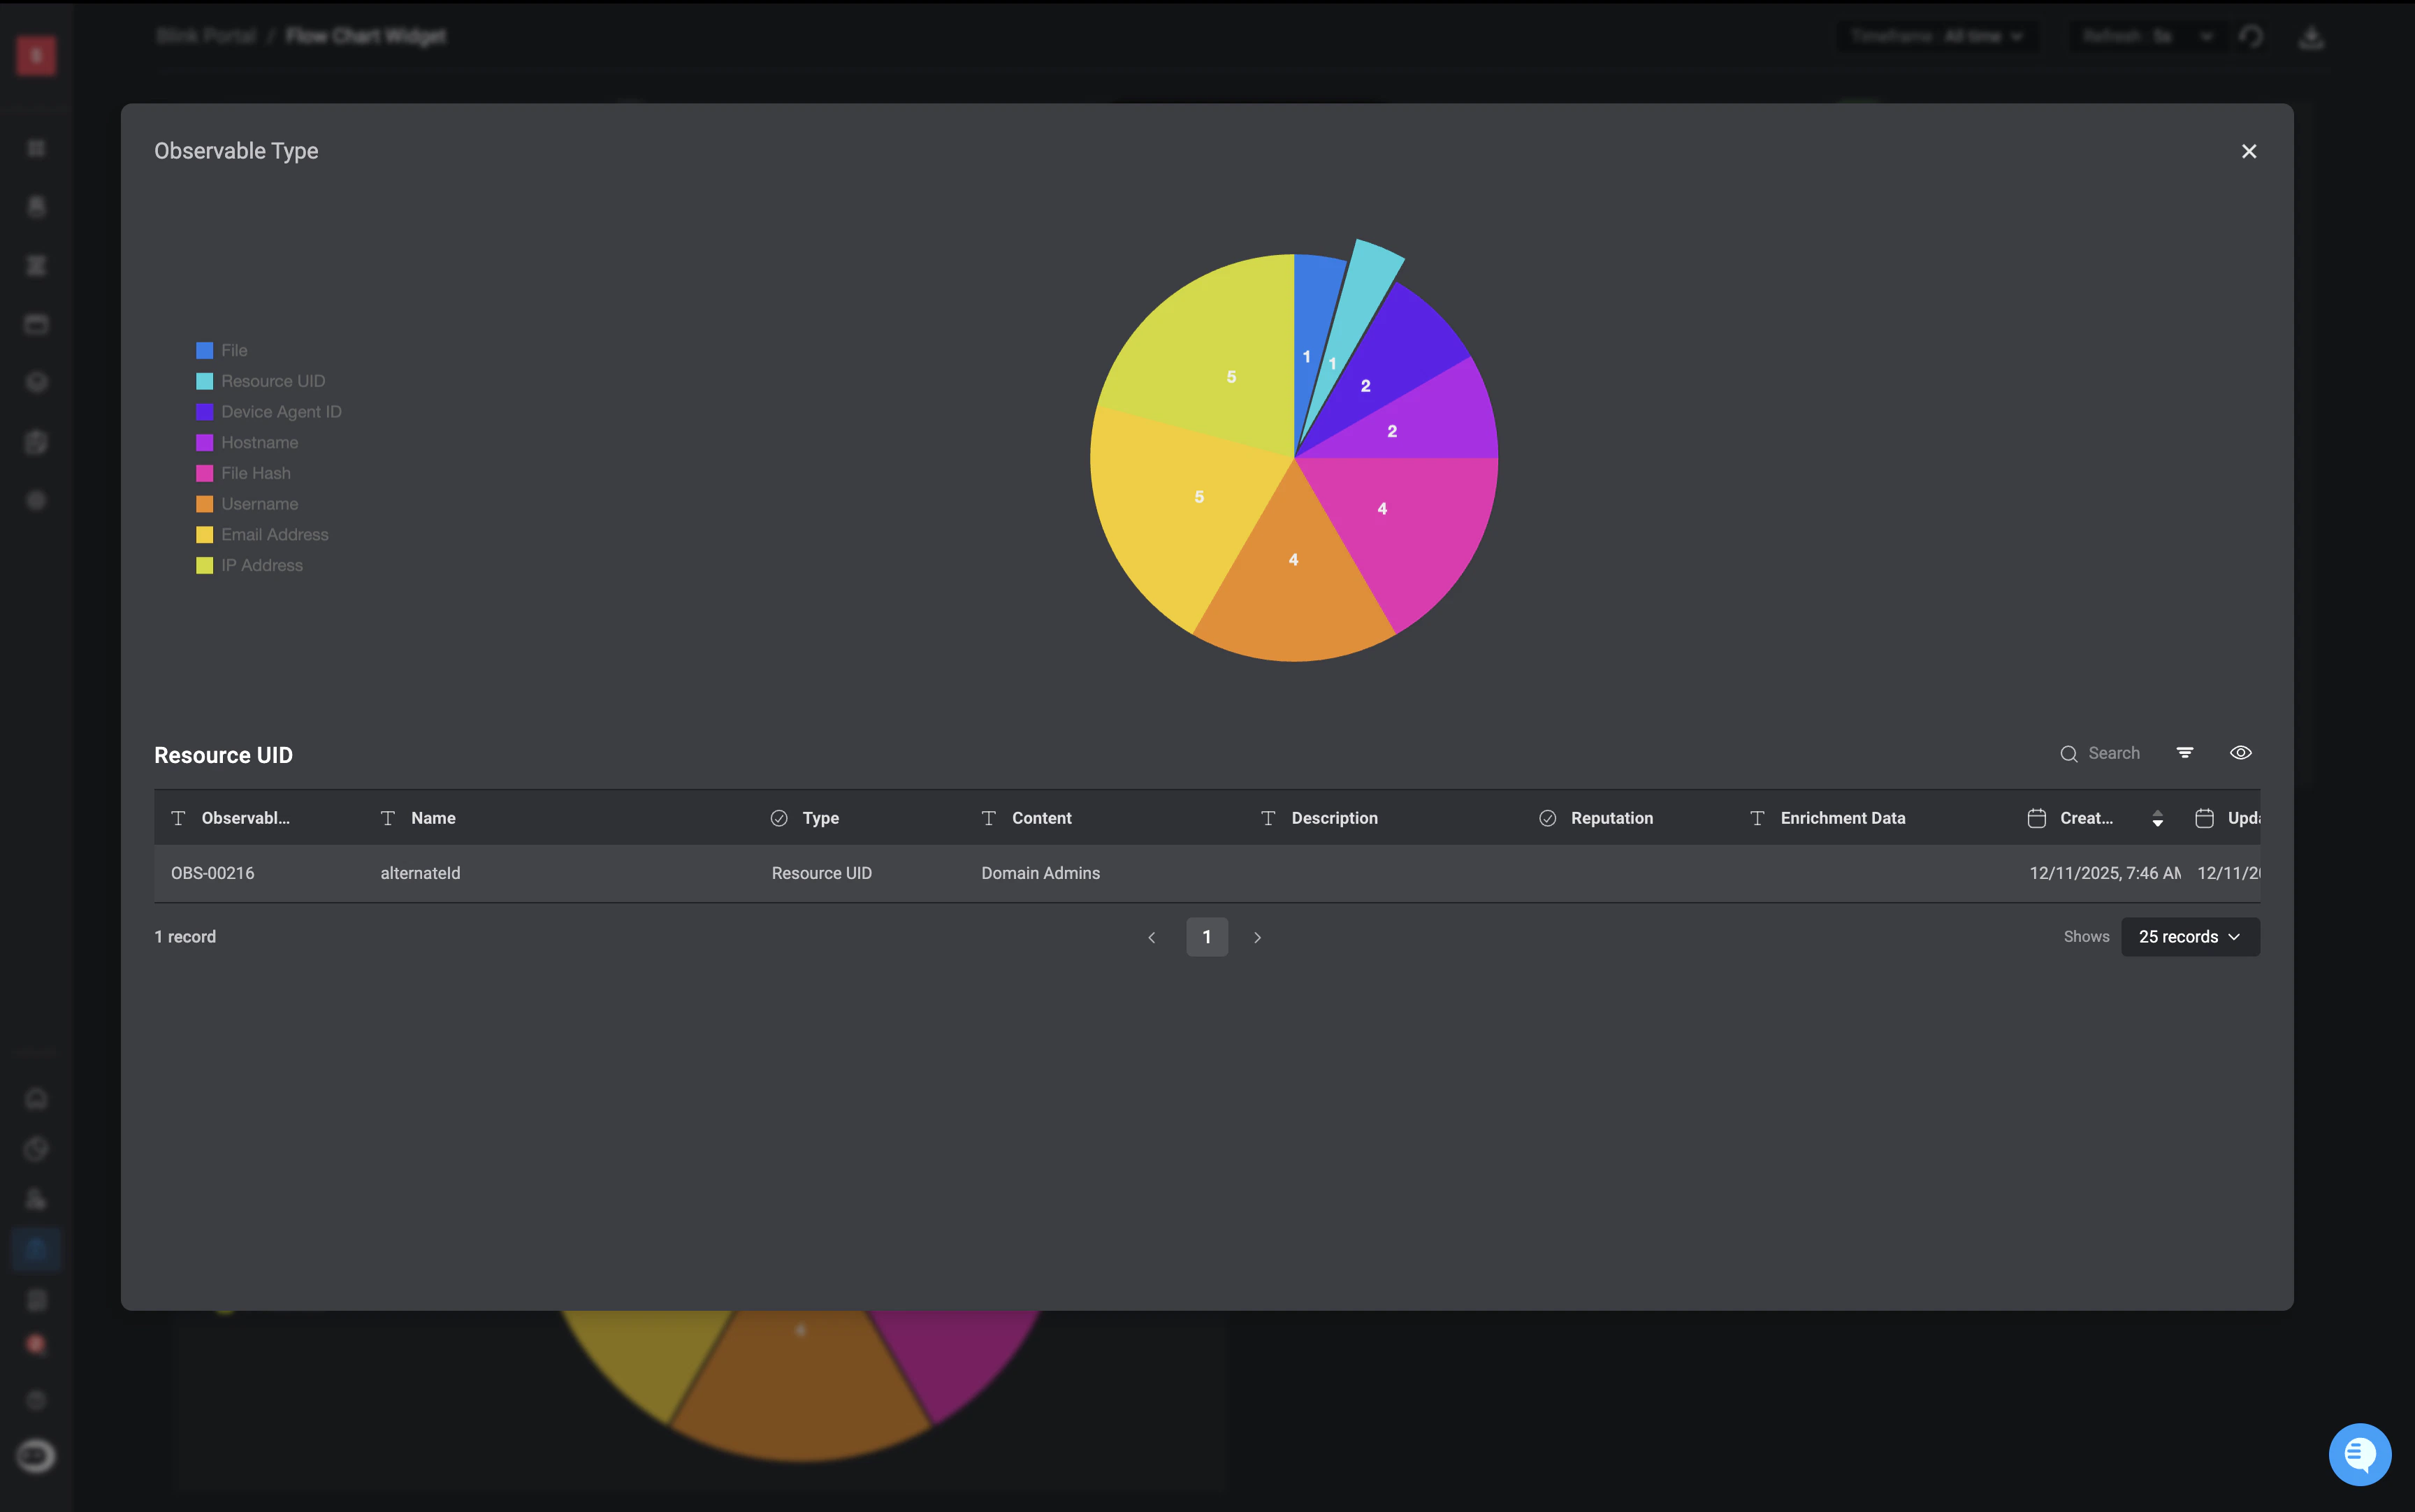
In the dashboards view mode, you can click on a widget to open an expanded view that displays the underlying raw data from the widget’s data source.
Within this expanded view, you can also interact directly with elements of the visualization to further refine the data being displayed. For example, selecting a specific slice in a pie chart or an individual bar in a bar chart will filter the results to show only the raw records associated with that selected element.
This allows you to quickly drill down into the data behind specific parts of the visualization directly from the dashboard.
**Note:** When a widget is grouped by a user field (e.g., Case Manager or custom user fields), the expanded view shows the full underlying dataset
***
## Dashboard Widget's Expanded View
In the dashboards view mode, you can click on a widget to open an expanded view that displays the underlying raw data from the widget’s data source.
Within this expanded view, you can also interact directly with elements of the visualization to further refine the data being displayed. For example, selecting a specific slice in a pie chart or an individual bar in a bar chart will filter the results to show only the raw records associated with that selected element.
This allows you to quickly drill down into the data behind specific parts of the visualization directly from the dashboard.
**Note:** When a widget is grouped by a user field (e.g., Case Manager or custom user fields), the expanded view shows the full underlying dataset
 ***
## Dashboard Settings in the Blink Portal
**Note**: These settings are only available to users with access to the workspace the selected dashboard is part of.
To access the Blink Portal's settings, click the menu and choose from the following options:
1. **Manage Portal Access**- Enter the email address of a user(s) or group(s) within your tenant to share the selected dashboard in the Blink Portal.
2. **Navigate to the selected workflow**- Navigate directly to the dashboard you have selected in the Blink Portal.
3. Navigate to the **workspace** where the selected dashboard is located.
***
## Dashboard Settings in the Blink Portal
**Note**: These settings are only available to users with access to the workspace the selected dashboard is part of.
To access the Blink Portal's settings, click the menu and choose from the following options:
1. **Manage Portal Access**- Enter the email address of a user(s) or group(s) within your tenant to share the selected dashboard in the Blink Portal.
2. **Navigate to the selected workflow**- Navigate directly to the dashboard you have selected in the Blink Portal.
3. Navigate to the **workspace** where the selected dashboard is located.
 ***
## Sharing Dashboards to the Blink Portal
To view a dashboard you created in the Blink Portal, you must first publish and share it. By default, the dashboard is shared only with you, but you can choose to share it with additional users or groups to provide them access.
If you de-activate the dashboard, it will not show up in the Blink Portal
Follow these steps to publish and share a dashboard you created in the Blink Portal:
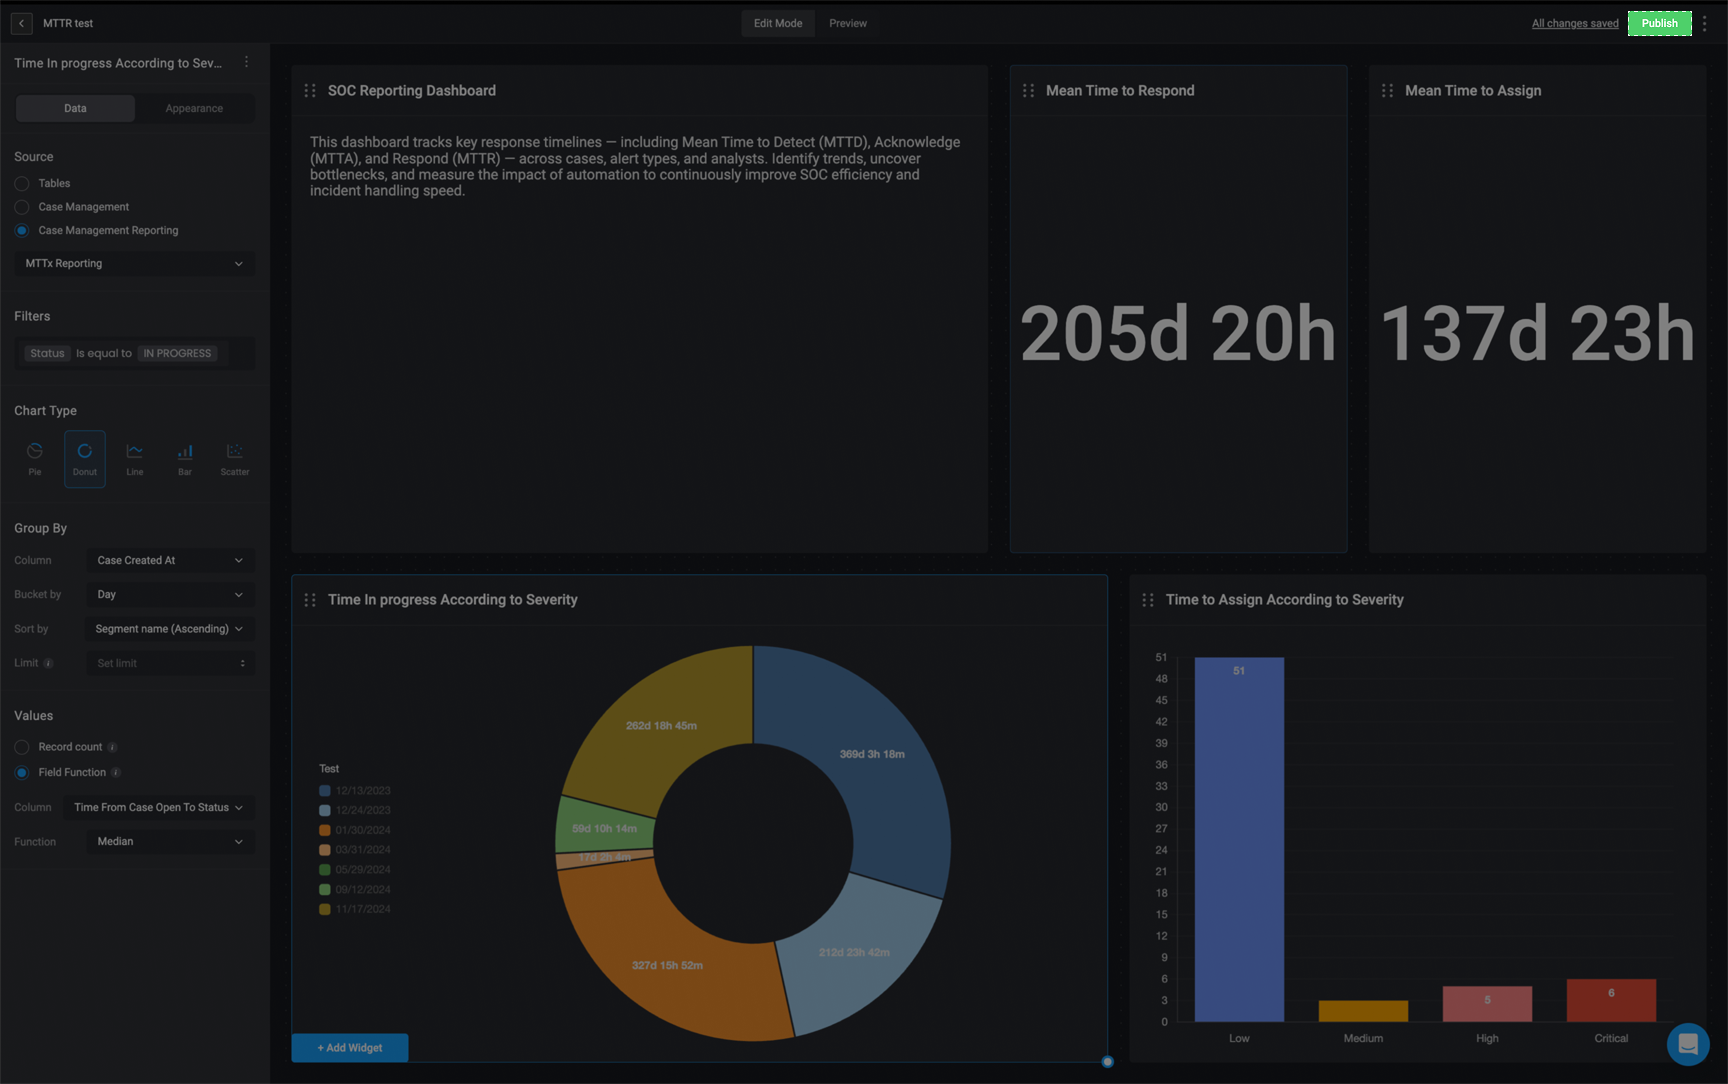
In the top-right corner of your dashboard, click the **Publish** button to start the sharing process.
***
## Sharing Dashboards to the Blink Portal
To view a dashboard you created in the Blink Portal, you must first publish and share it. By default, the dashboard is shared only with you, but you can choose to share it with additional users or groups to provide them access.
If you de-activate the dashboard, it will not show up in the Blink Portal
Follow these steps to publish and share a dashboard you created in the Blink Portal:
In the top-right corner of your dashboard, click the **Publish** button to start the sharing process.
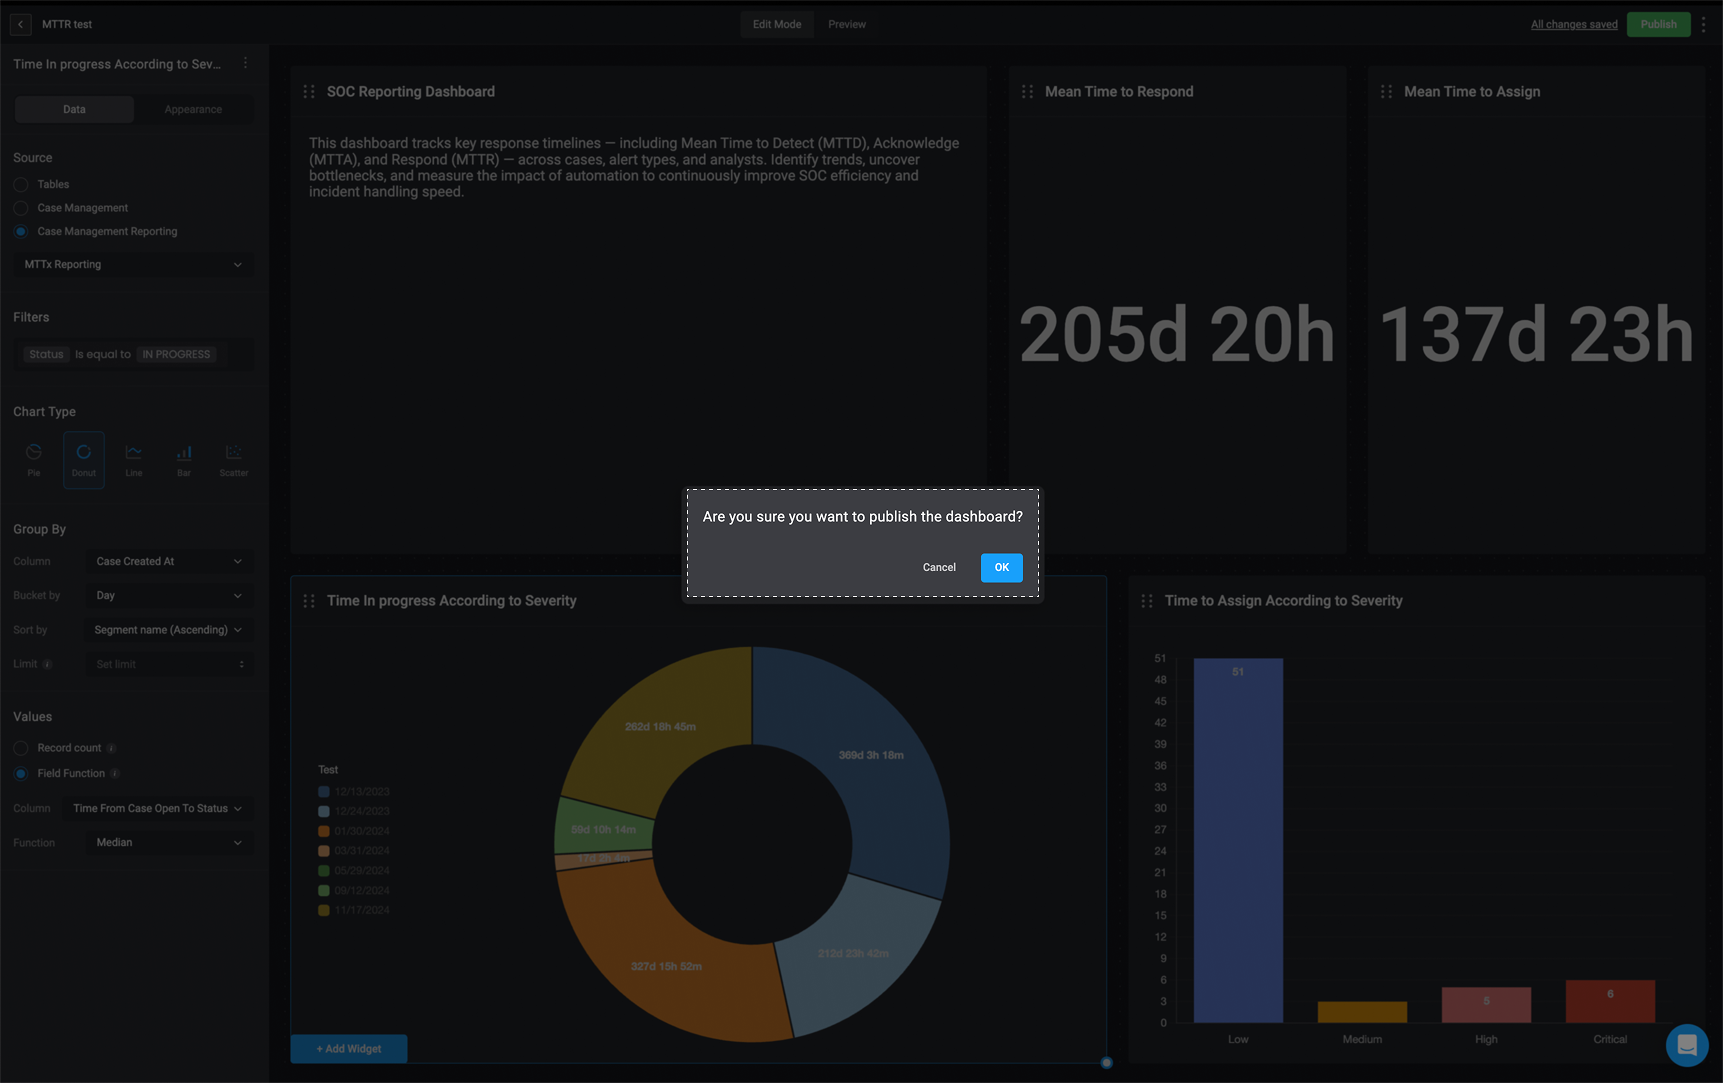
 A pop-up will appear asking you to confirm that you want to share the dashboard. Click **Confirm** to proceed.
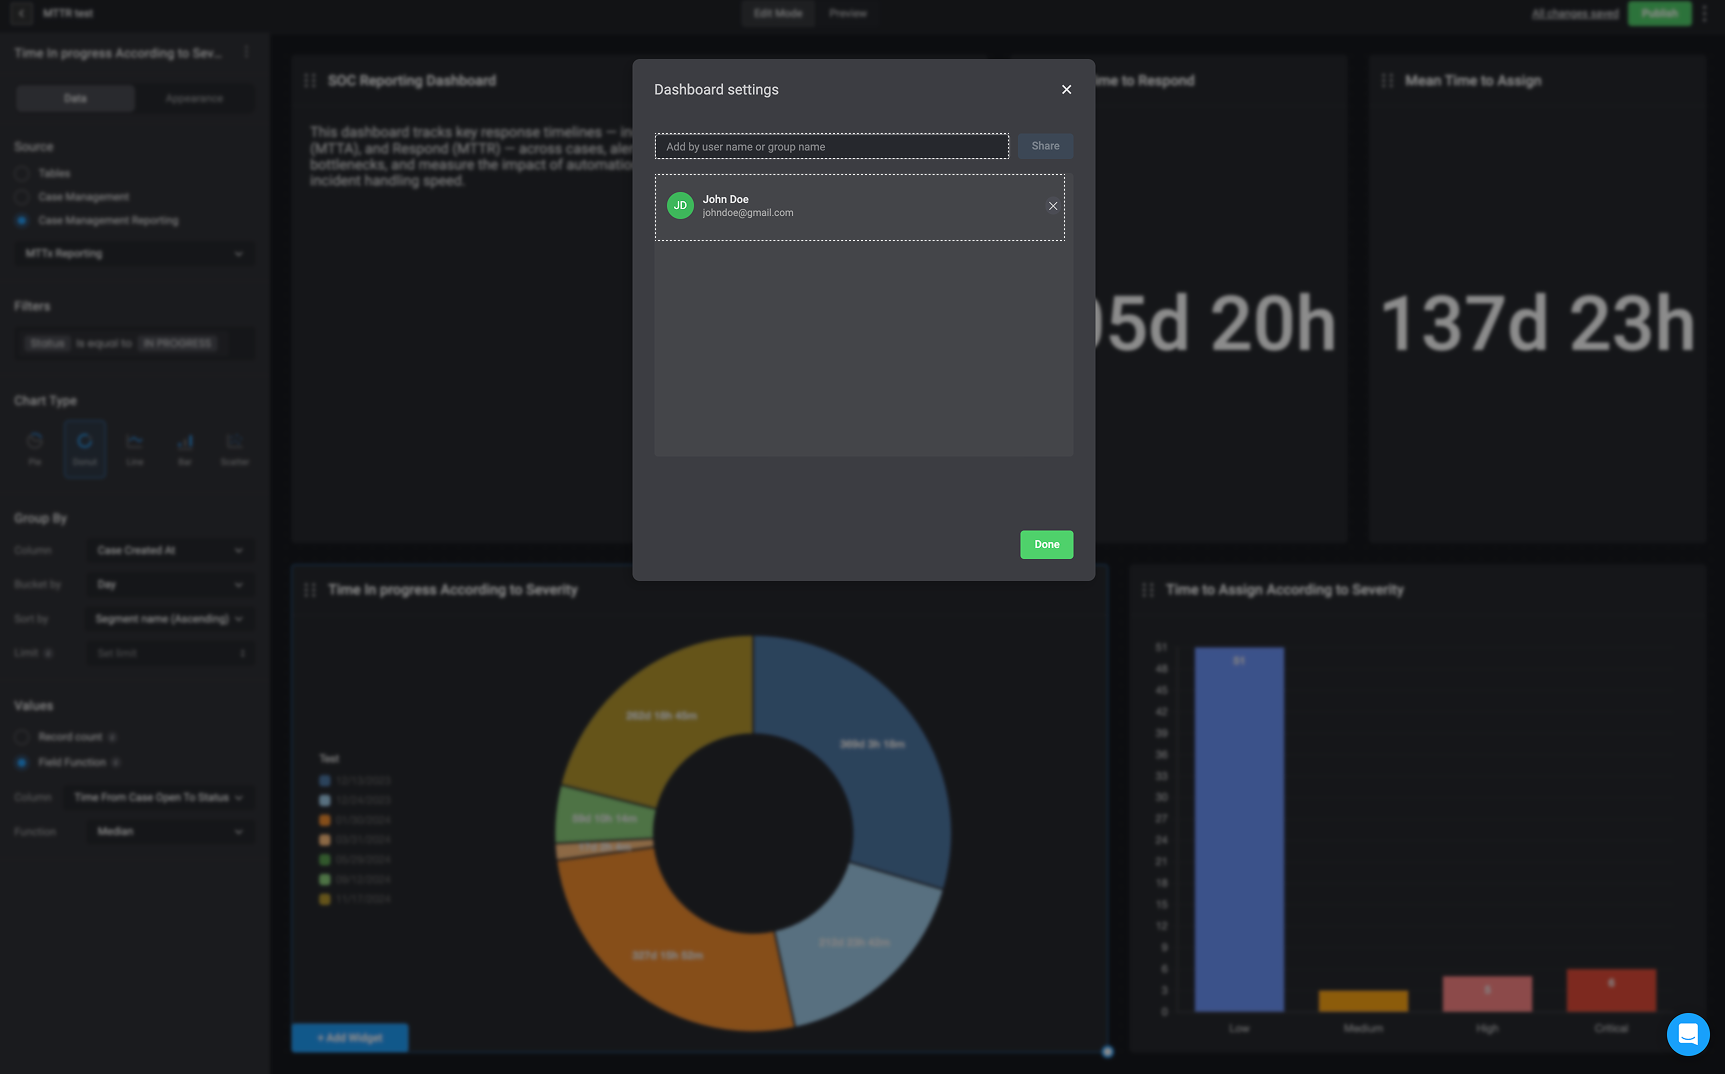
 After confirmation, you can enter the username(s) or group name(s) you want to share the dashboard with. By default, the dashboard is automatically shared with you and can now be found in the Blink Portal.
 ***
## Exporting Dashboards
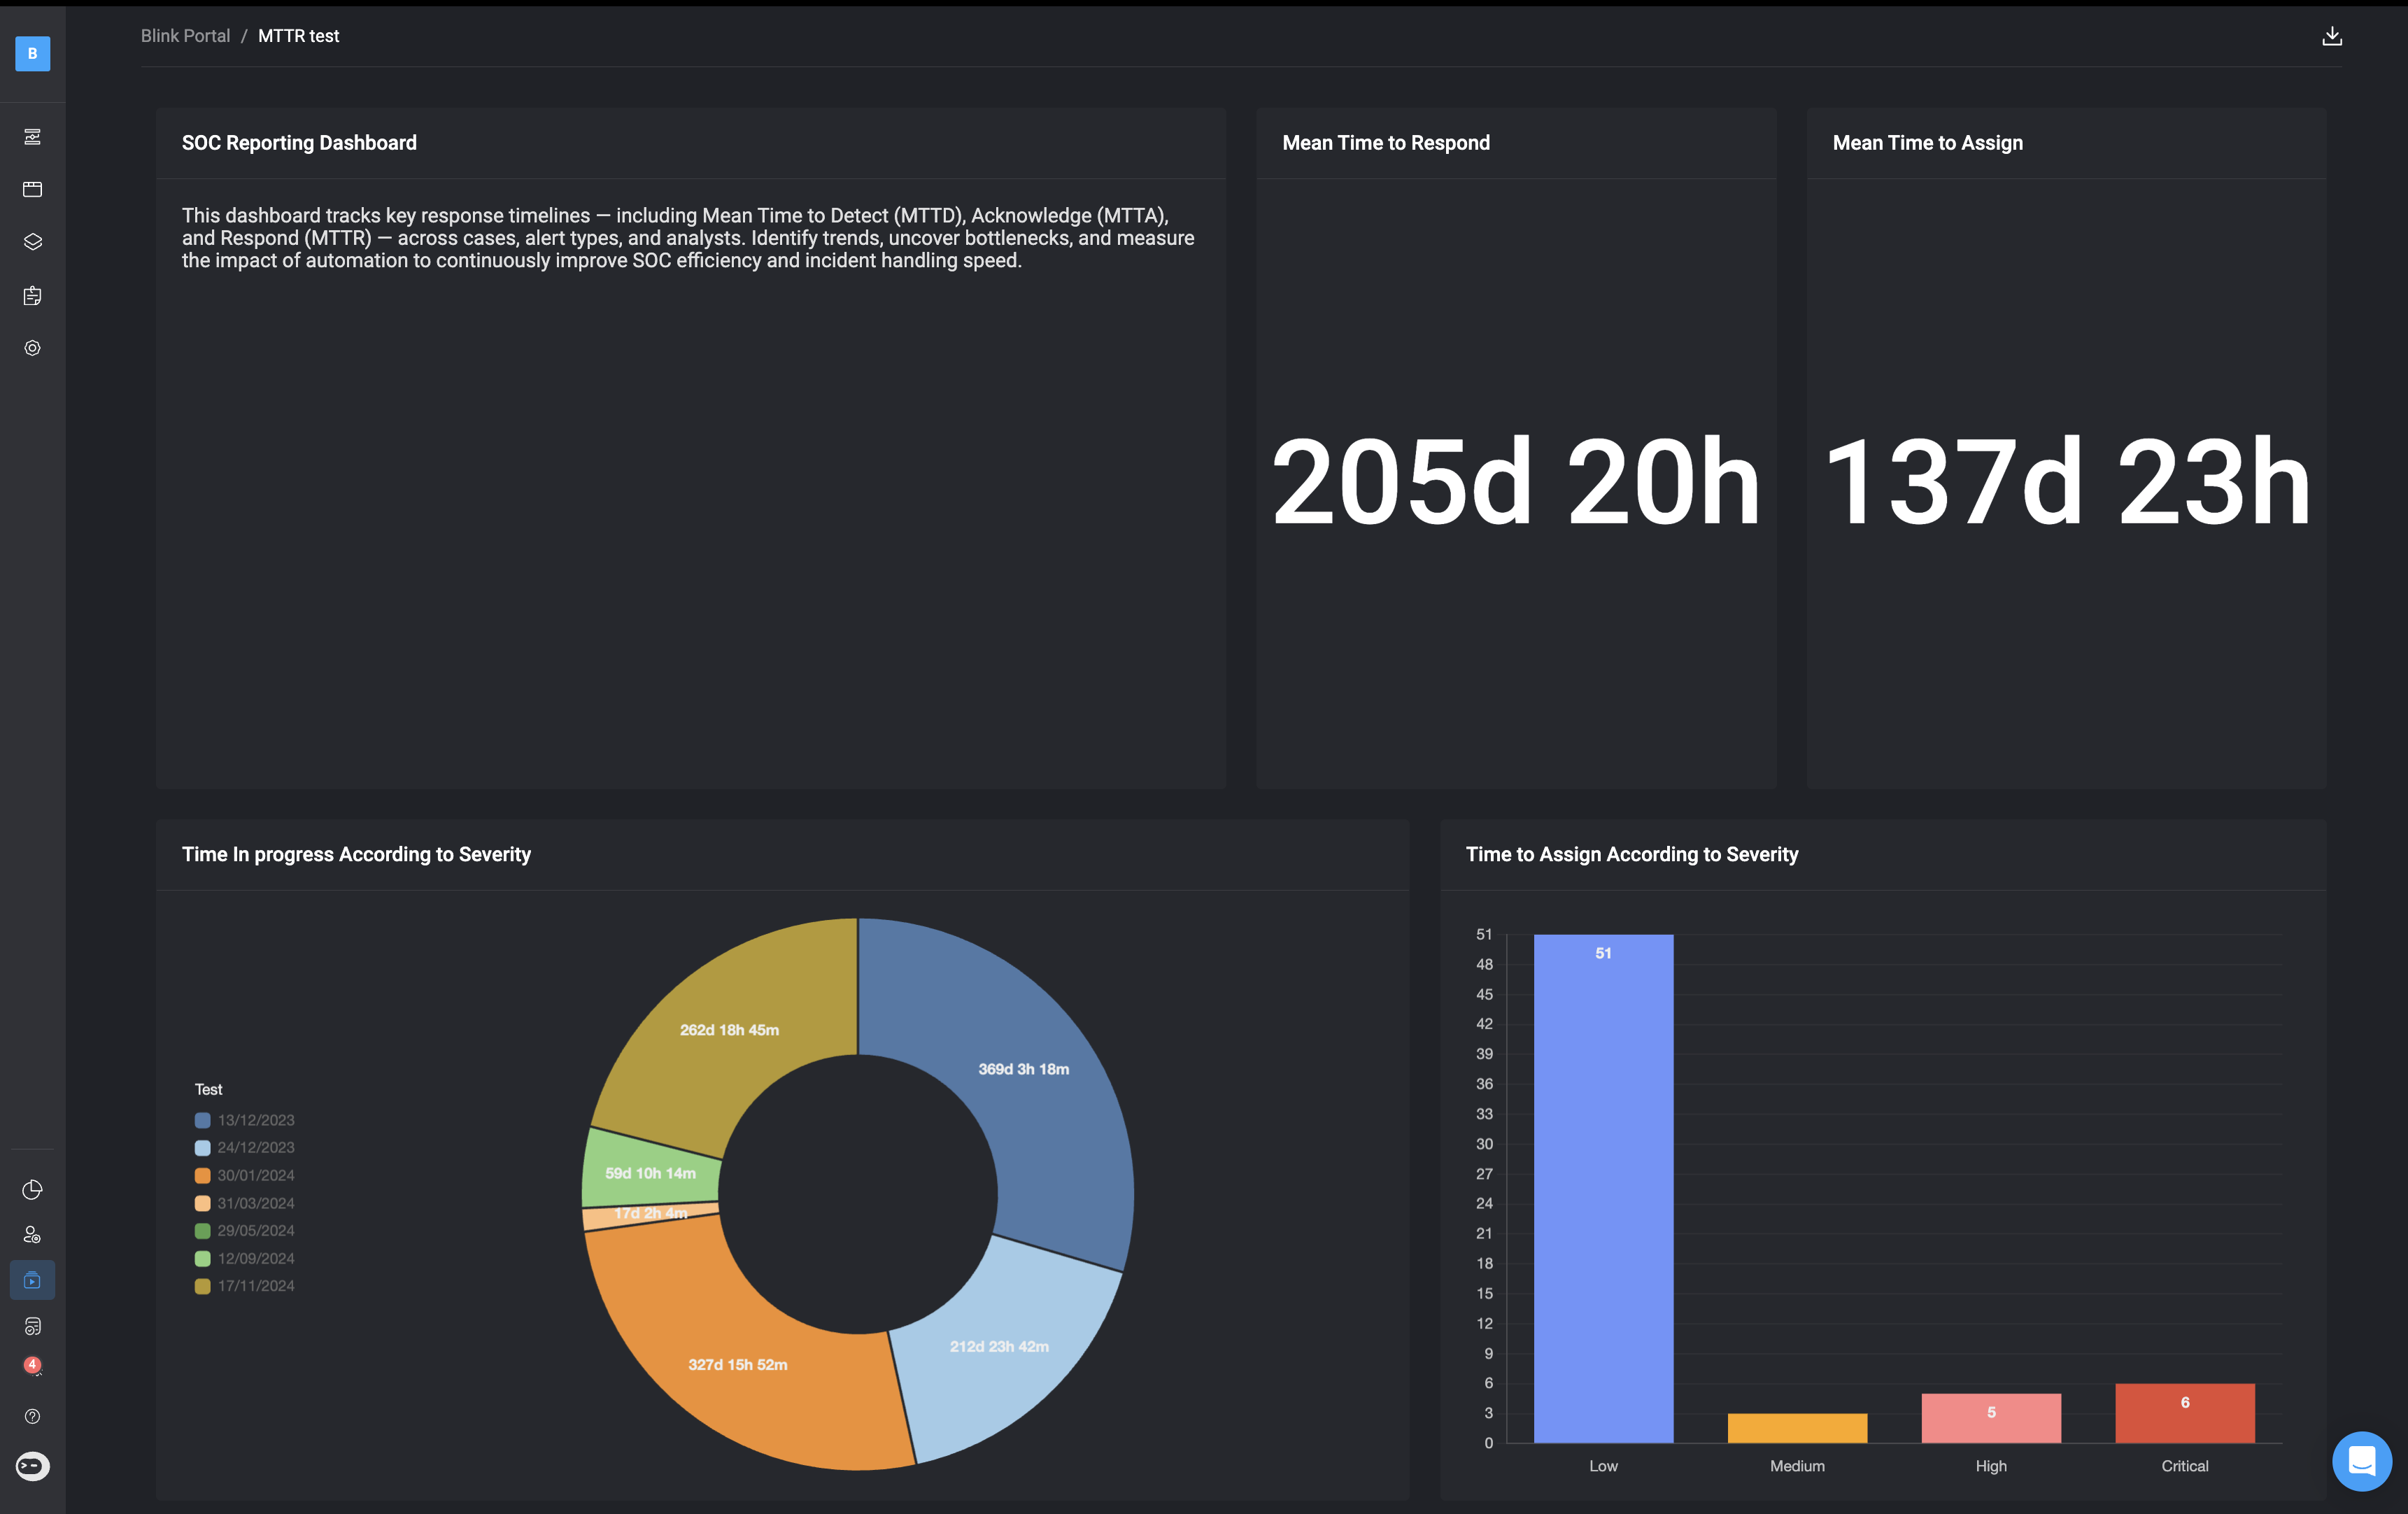
Once you find the dashboard you want, click on it to explore all its **widgets and data**. You can also **export the dashboard** by clicking the button in the top-right corner of the interface.
***
## Exporting Dashboards
Once you find the dashboard you want, click on it to explore all its **widgets and data**. You can also **export the dashboard** by clicking the button in the top-right corner of the interface.
 For detailed guidance on Agents, visit the [Agent Documentation](/docs/agent-builder/agent-builder).
In the **Agents** tab of the Blink Portal, you can access all agents that you been shared with you in the Blink Portal.
* **Filter by workspace:** Narrow down dashboards based on the workspace they belong to.
* **Search bar:** Quickly locate a specific dashboard by name or keyword.
For detailed guidance on Agents, visit the [Agent Documentation](/docs/agent-builder/agent-builder).
In the **Agents** tab of the Blink Portal, you can access all agents that you been shared with you in the Blink Portal.
* **Filter by workspace:** Narrow down dashboards based on the workspace they belong to.
* **Search bar:** Quickly locate a specific dashboard by name or keyword.
 ***
## Agent Settings in the Blink Portal
**Note**: These settings are only available to users with access to the workspace the selected dashboard is part of.
To access the Blink Portal's settings, click the menu and choose from the following options:
1. **Manage Portal Access**- Enter the email address of a user(s) or group(s) within your tenant to share the selected agent in the Blink Portal.
2. **Navigate to the selected Agent**- Navigate directly to the agent you have selected in the Blink Portal.
3. Navigate to the **workspace** where the selected agent is located.
***
## Agent Settings in the Blink Portal
**Note**: These settings are only available to users with access to the workspace the selected dashboard is part of.
To access the Blink Portal's settings, click the menu and choose from the following options:
1. **Manage Portal Access**- Enter the email address of a user(s) or group(s) within your tenant to share the selected agent in the Blink Portal.
2. **Navigate to the selected Agent**- Navigate directly to the agent you have selected in the Blink Portal.
3. Navigate to the **workspace** where the selected agent is located.
 ***
***