> ## Documentation Index
> Fetch the complete documentation index at: https://docs.blinkops.com/llms.txt
> Use this file to discover all available pages before exploring further.

# Agent Usage Tracking

> Track agent usage metrics and monitor activity through the Agent Tracking Dashboard in Blink.

<Note>**Note**: Only users with the [Tenant Admin](/docs/blink-platform/account-management/roles#1-admin) role have permission to access this Dashboard</Note>

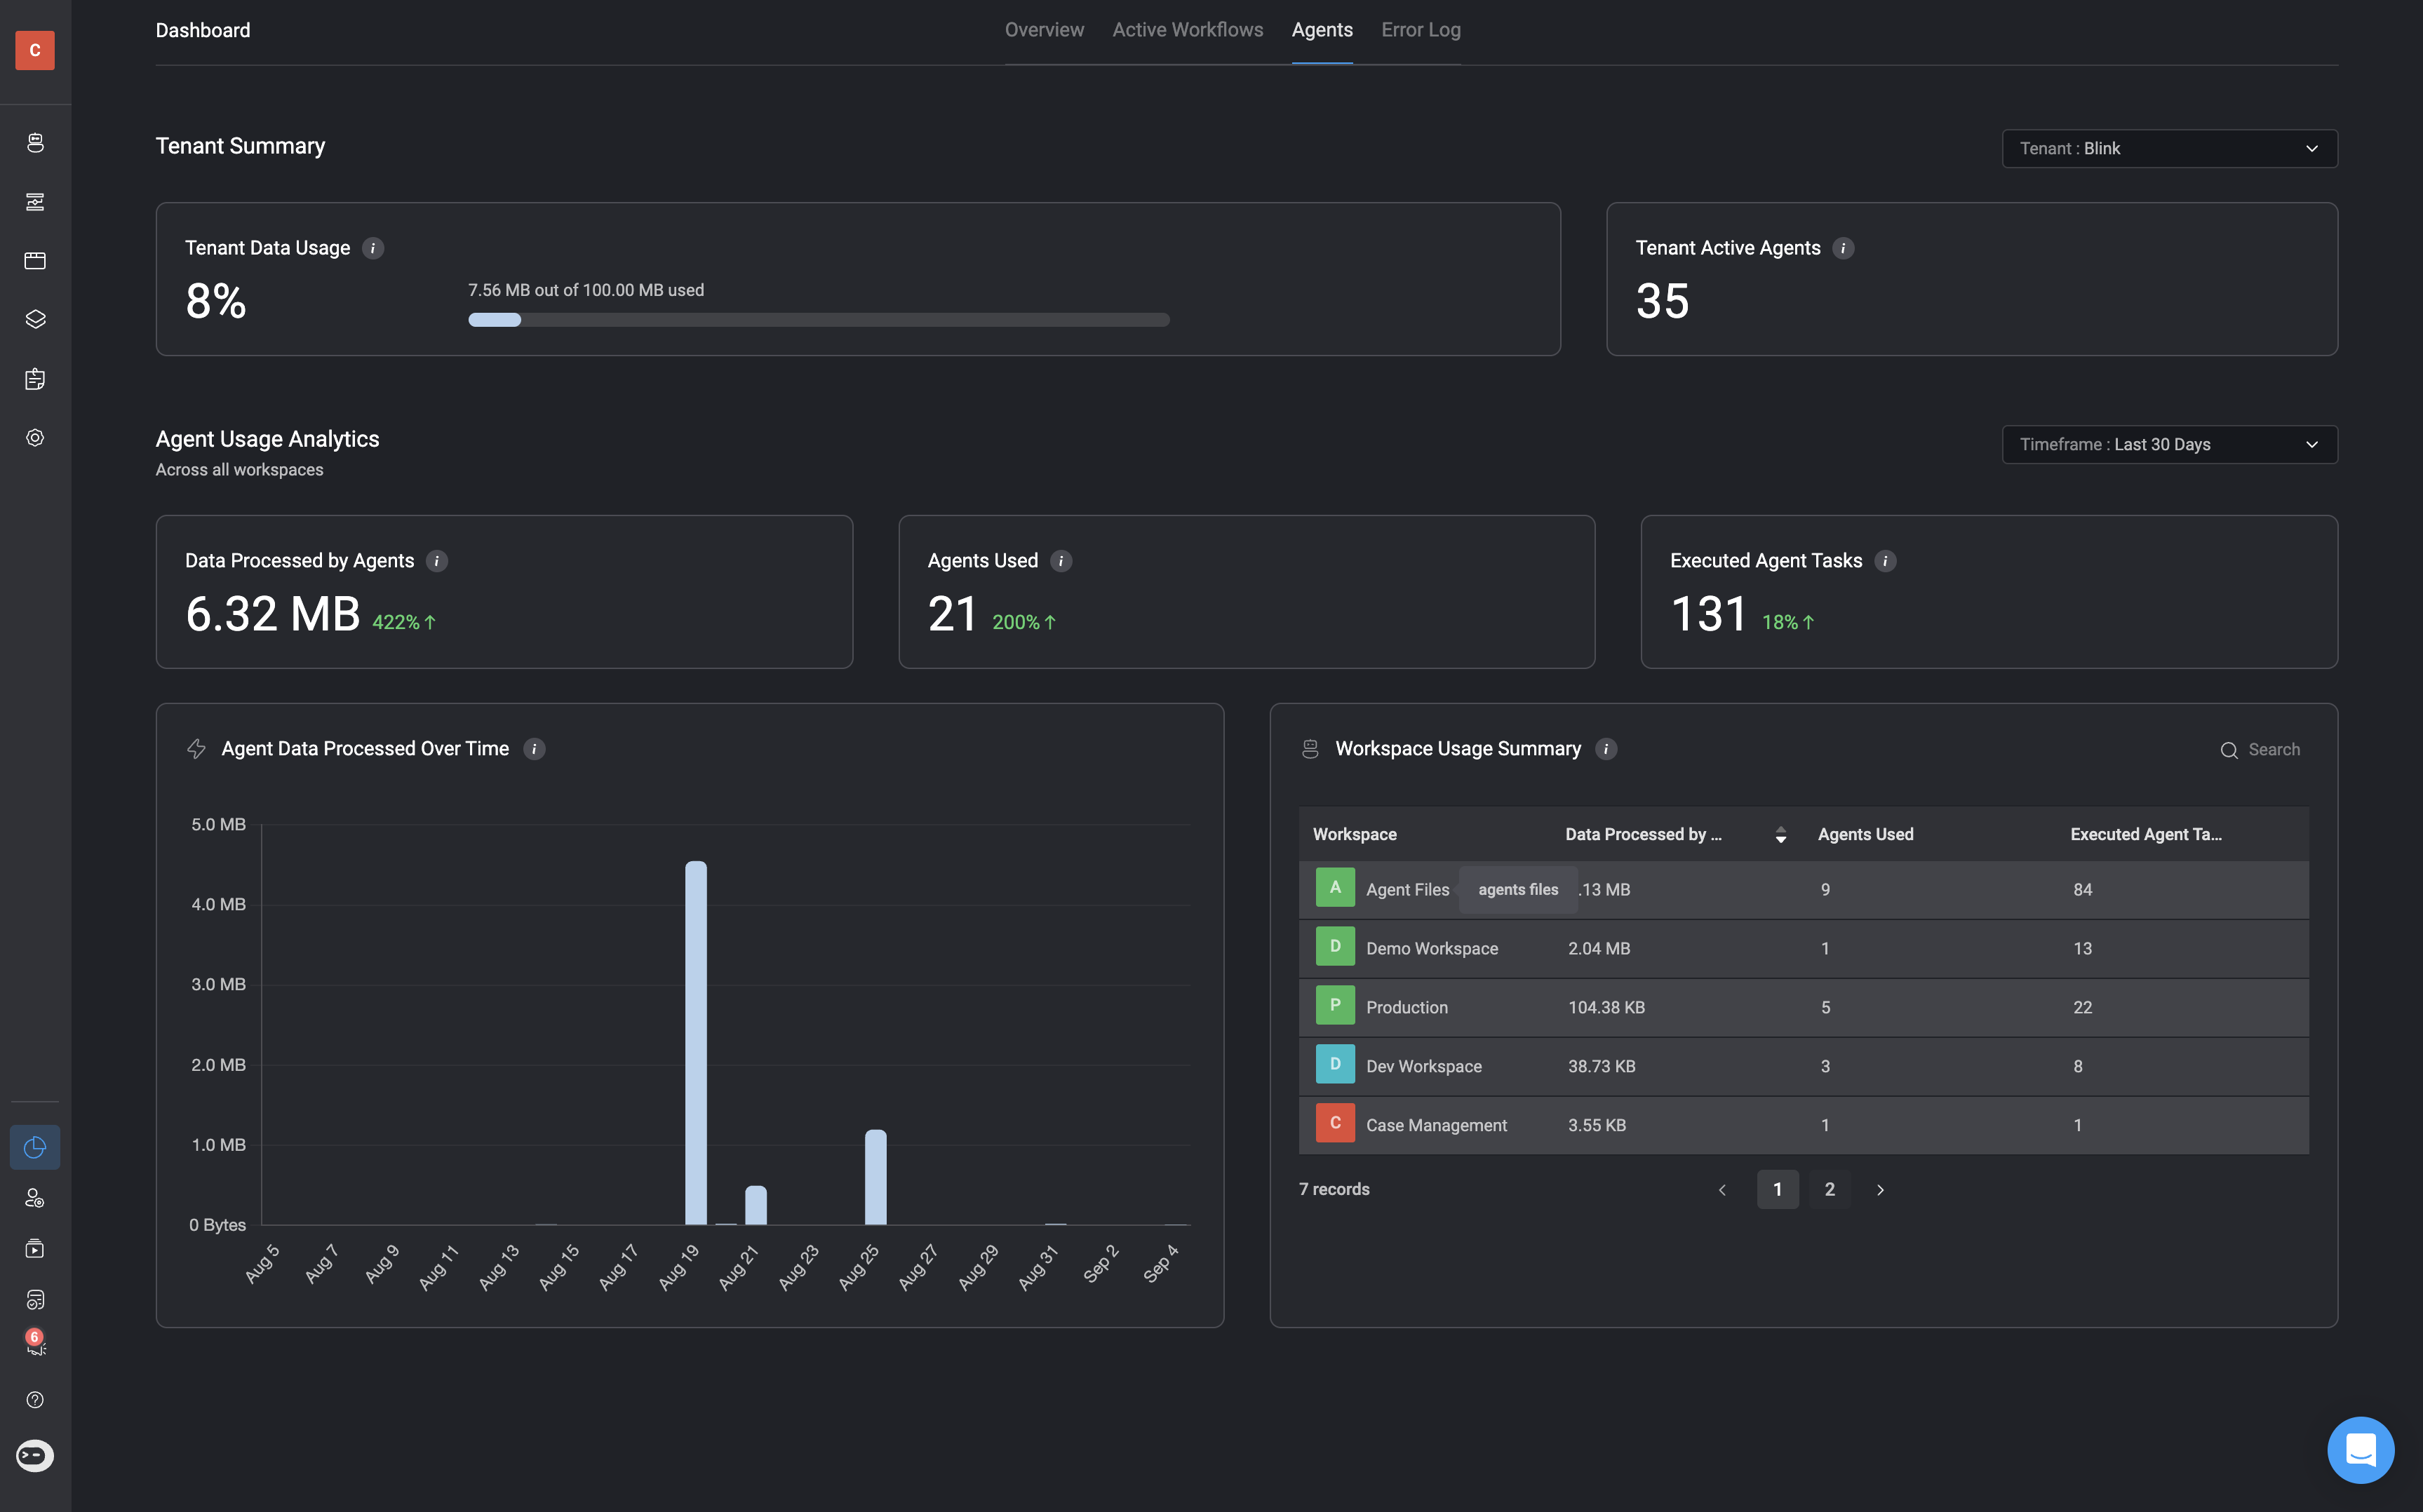
In the [Tenant Dashboard](/docs/blink-platform/workspaces/monitoring-workspaces), the **Agents** tab provides access to the **Agent Tracking Dashboard**. This dashboard gives you a comprehensive view of agent activity across your tenant and workspaces. It highlights how agents are being used, tracks data processing, and surfaces usage trends over time. With this visibility, you can effectively track agent usage, optimize resource allocation, and ensure you stay within your quota limits.

With this dashboard, it can help you:

* Track total data processed by agents across your tenant.
* See how many agents are active and in use.
* Measure executed tasks and data trends over time.

<Frame>
  <img src="https://mintcdn.com/blinkops-2/xuH6es4fwEuYIHOx/img/AgentBuilder/AgentTrackingDashboard.png?fit=max&auto=format&n=xuH6es4fwEuYIHOx&q=85&s=9bbe2f3981b46ca57490c9273ad3d7ad" width="3454" height="2156" data-path="img/AgentBuilder/AgentTrackingDashboard.png" />
</Frame>

***

## Automatic Quota Threshold Alerts

Email notifications are sent to all [tenant admins](/docs/blink-platform/account-management/roles#1-admin) at the following thresholds:

* **50%**
* **75%**
* **90%**
* **Blocked** (when the tenant’s licensed data quota has been reached)

A **warning alert** is displayed when you reach **50%** and more of your tenant’s data processing quota. This becomes a critical alert when **90%** of the licensed data is exceeded.

**For Example:**

<Frame>
  <img src="https://mintcdn.com/blinkops-2/zd9kISzuJpEayWeP/img/AgentBuilder/WarningNotification.png?fit=max&auto=format&n=zd9kISzuJpEayWeP&q=85&s=4d0232e4d2f5c915c9fd3c7222bd5cb4" width="3262" height="562" data-path="img/AgentBuilder/WarningNotification.png" />
</Frame>

***

## Tenant Summary

<Frame>
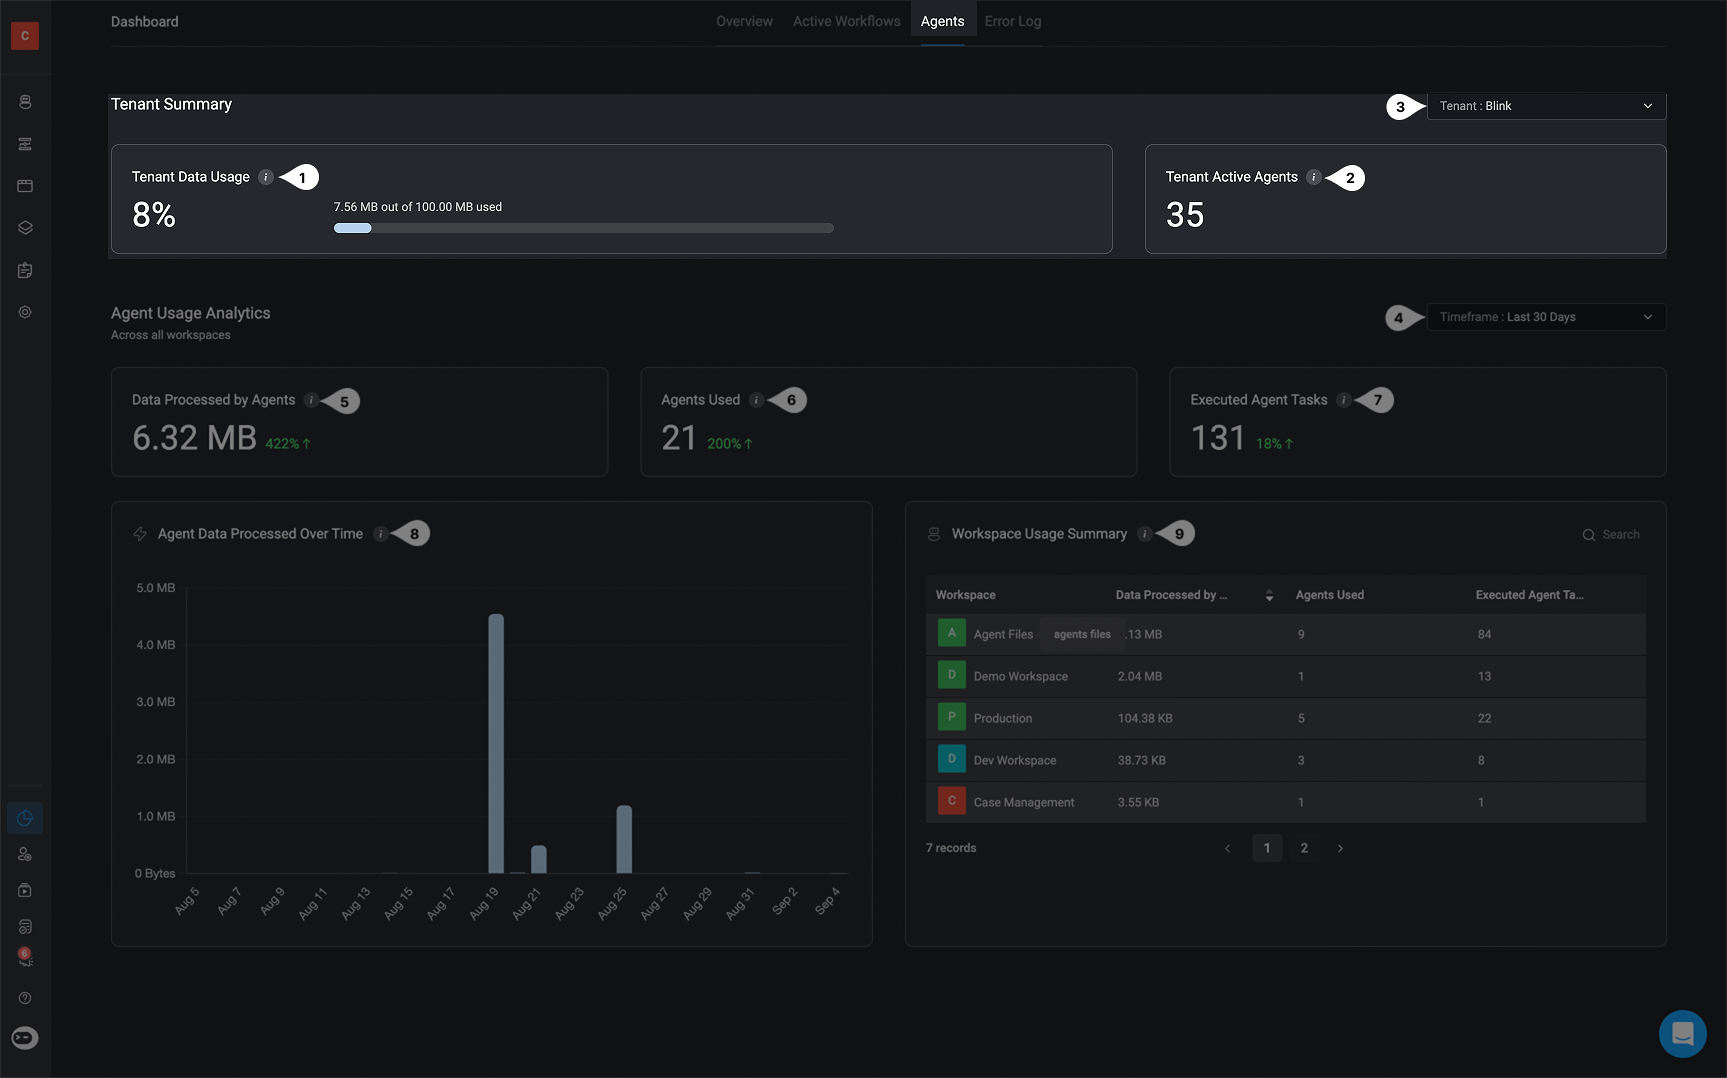
  <img src="https://mintcdn.com/blinkops-2/kRkdtvrA8pDkqNHK/img/AgentBuilder/TenantSummary.png?fit=max&auto=format&n=kRkdtvrA8pDkqNHK&q=85&s=9e41a3739316f26263b2407f9bdd1131" width="1727" height="1078" data-path="img/AgentBuilder/TenantSummary.png" />
</Frame>

<div className="integrations-table">
  |       | Title                    | Description                                                                                          |
  | ----- | ------------------------ | ---------------------------------------------------------------------------------------------------- |
  | **1** | **Tenant Data Usage**    | Total data processed by agents across all workspaces in your tenant out of the total licensed quota. |
  | **2** | **Tenant Active Agents** | Number of enabled agents available across all workspaces in this tenant.                             |
  | **3** | **Tenant**               | Dropdown to filter and view agent data specific to a selected tenant                                 |
</div>

***

## Agent Usage Analytics - Across All Workspaces

<Frame>
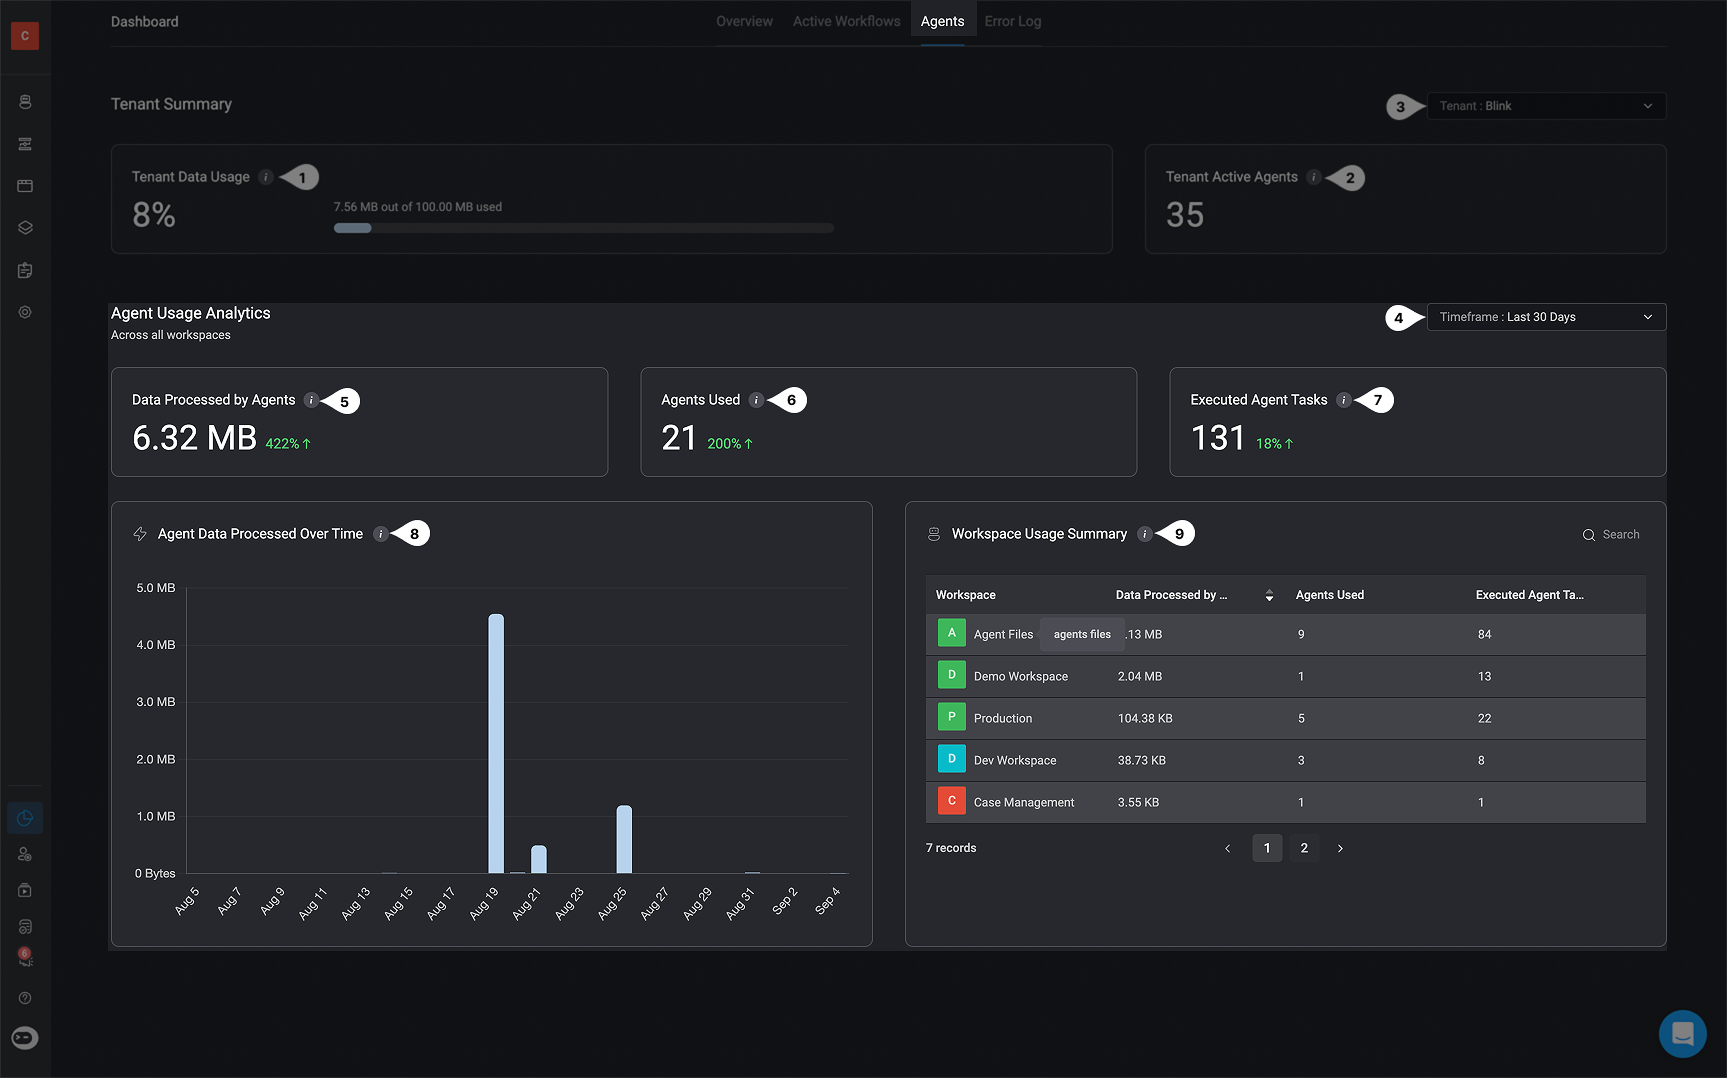
  <img src="https://mintcdn.com/blinkops-2/kRkdtvrA8pDkqNHK/img/AgentBuilder/WorkspaceSummary.png?fit=max&auto=format&n=kRkdtvrA8pDkqNHK&q=85&s=6e53bbb466818b38883a6c0863ac4239" width="1727" height="1078" data-path="img/AgentBuilder/WorkspaceSummary.png" />
</Frame>

<div className="integrations-table">
  |       | Title                                                      | Description                                                                                               |
  | ----- | ---------------------------------------------------------- | --------------------------------------------------------------------------------------------------------- |
  | **4** | **Timeframe**                                              | Allows you to define the timeframe for the data displayed (e.g., last 7 days, last 30 days).              |
  | **5** | **Data Processed by Agents (across all workspaces)**       | Total data processed by agents in the selected time period.                                               |
  | **6** | **Agents Used (across all workspaces)**                    | Number of agents that ran at least once in the selected time period                                       |
  | **7** | **Executed Agent Tasks (across all workspaces)**           | Total number of times an agent task was executed in the selected time period.                             |
  | **8** | **Agent Data Processed Over Time (across all workspaces)** | Trend of data processed by agents over the selected time period. Helps visualize usage patterns and peaks |
  | **9** | **Workspace Usage Summary**                                | Shows agent activity and data usage per workspace for the selected time period.                           |
</div>

***